> ## Documentation Index
> Fetch the complete documentation index at: https://lightdash-mintlify-cccf65ca.mintlify.site/llms.txt
> Use this file to discover all available pages before exploring further.
# Usage analytics
> To understand who is accessing content or running queries in your Lightdash projects, we've built usage analytics to help you track this.
There are two ways of understanding user activity:
1. [**Usage Analytics dashboards**](#usage-analytics-dashboards) - these are dashboards created by Lightdash which give you an overview of your project's content and user activity.
2. [**Query tags**](#query-tags) - this is metadata which is added to your data warehouse queries and gives you information about who is querying data and what they are querying.
## Usage analytics dashboards
Each project has usage analytics dashboards created by Lightdash giving you an overview of your project's content and user activity.
To see your usage analytics dashboards for a project, just click on the `settings` icon, `project settings`, then `usage analytics`.
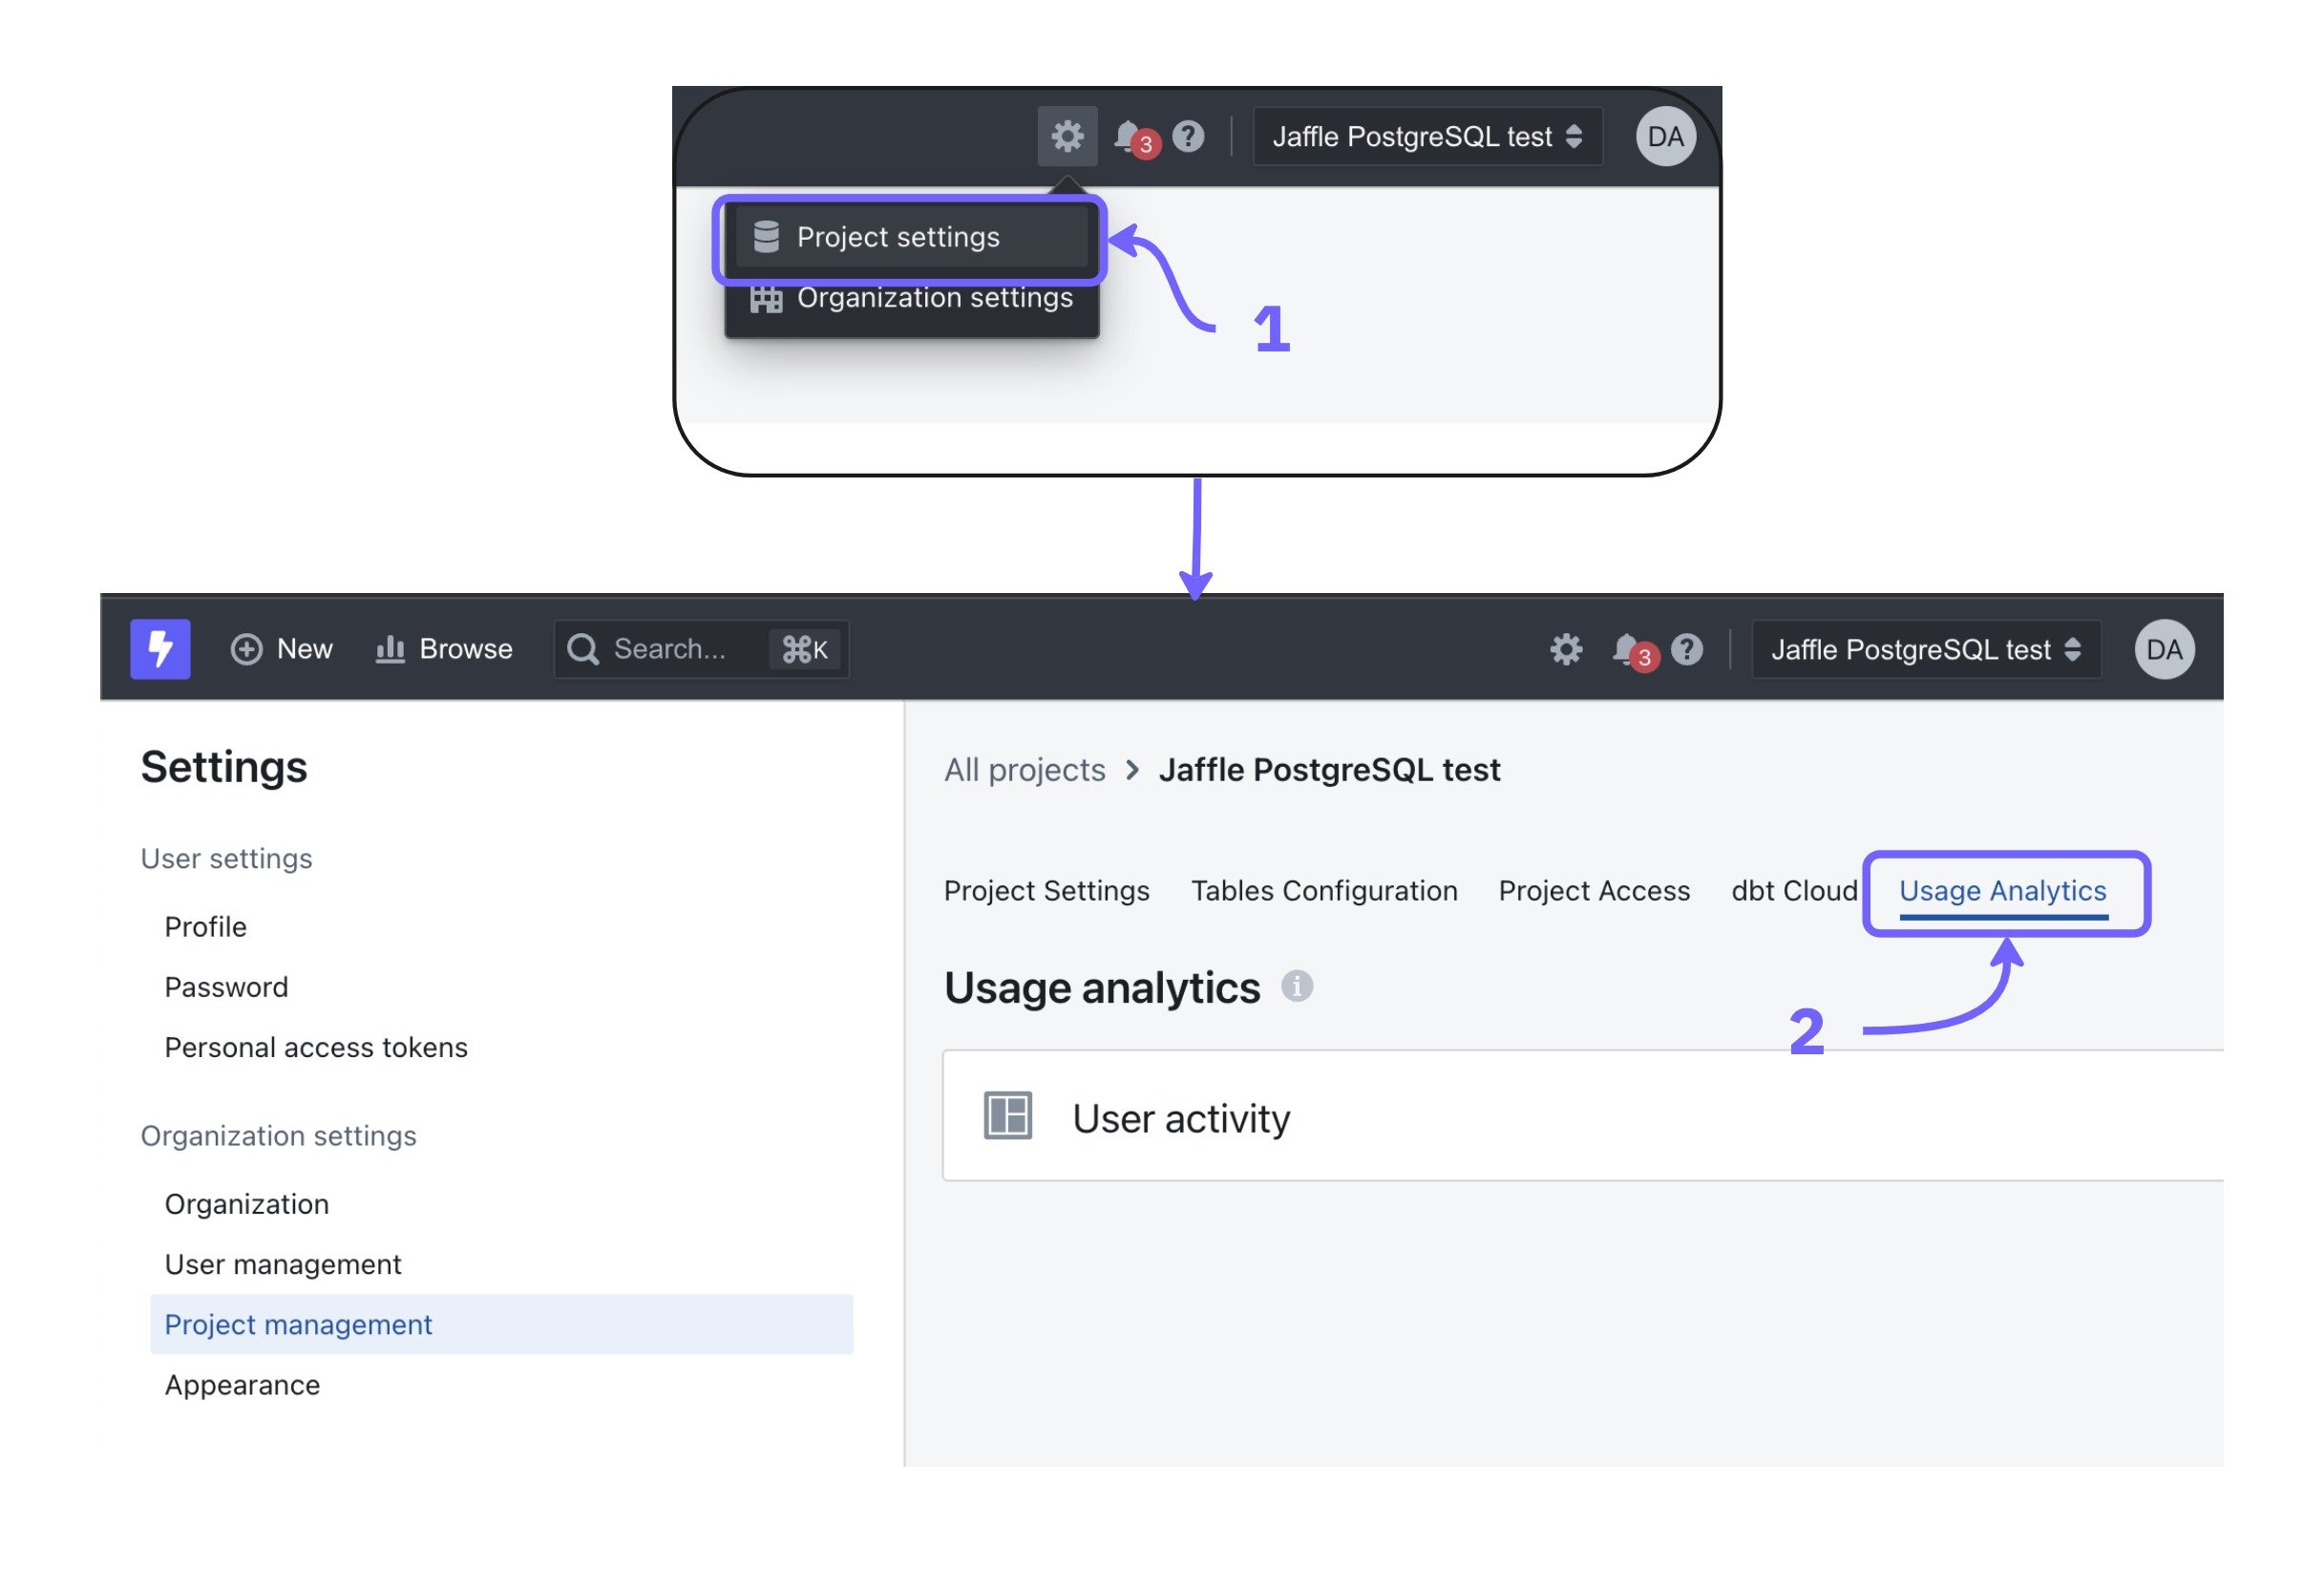 Or you can also use our [search bar](/get-started/exploring-data/exploring-your-content#using-the-search-bar) to get direct access to the different analytics dashboards by typing the name of the dashboard (eg: User activity)
### User Activity dashboard
This dashboard gives you an overview of the users in your project and the activity of your users.
Or you can also use our [search bar](/get-started/exploring-data/exploring-your-content#using-the-search-bar) to get direct access to the different analytics dashboards by typing the name of the dashboard (eg: User activity)
### User Activity dashboard
This dashboard gives you an overview of the users in your project and the activity of your users.
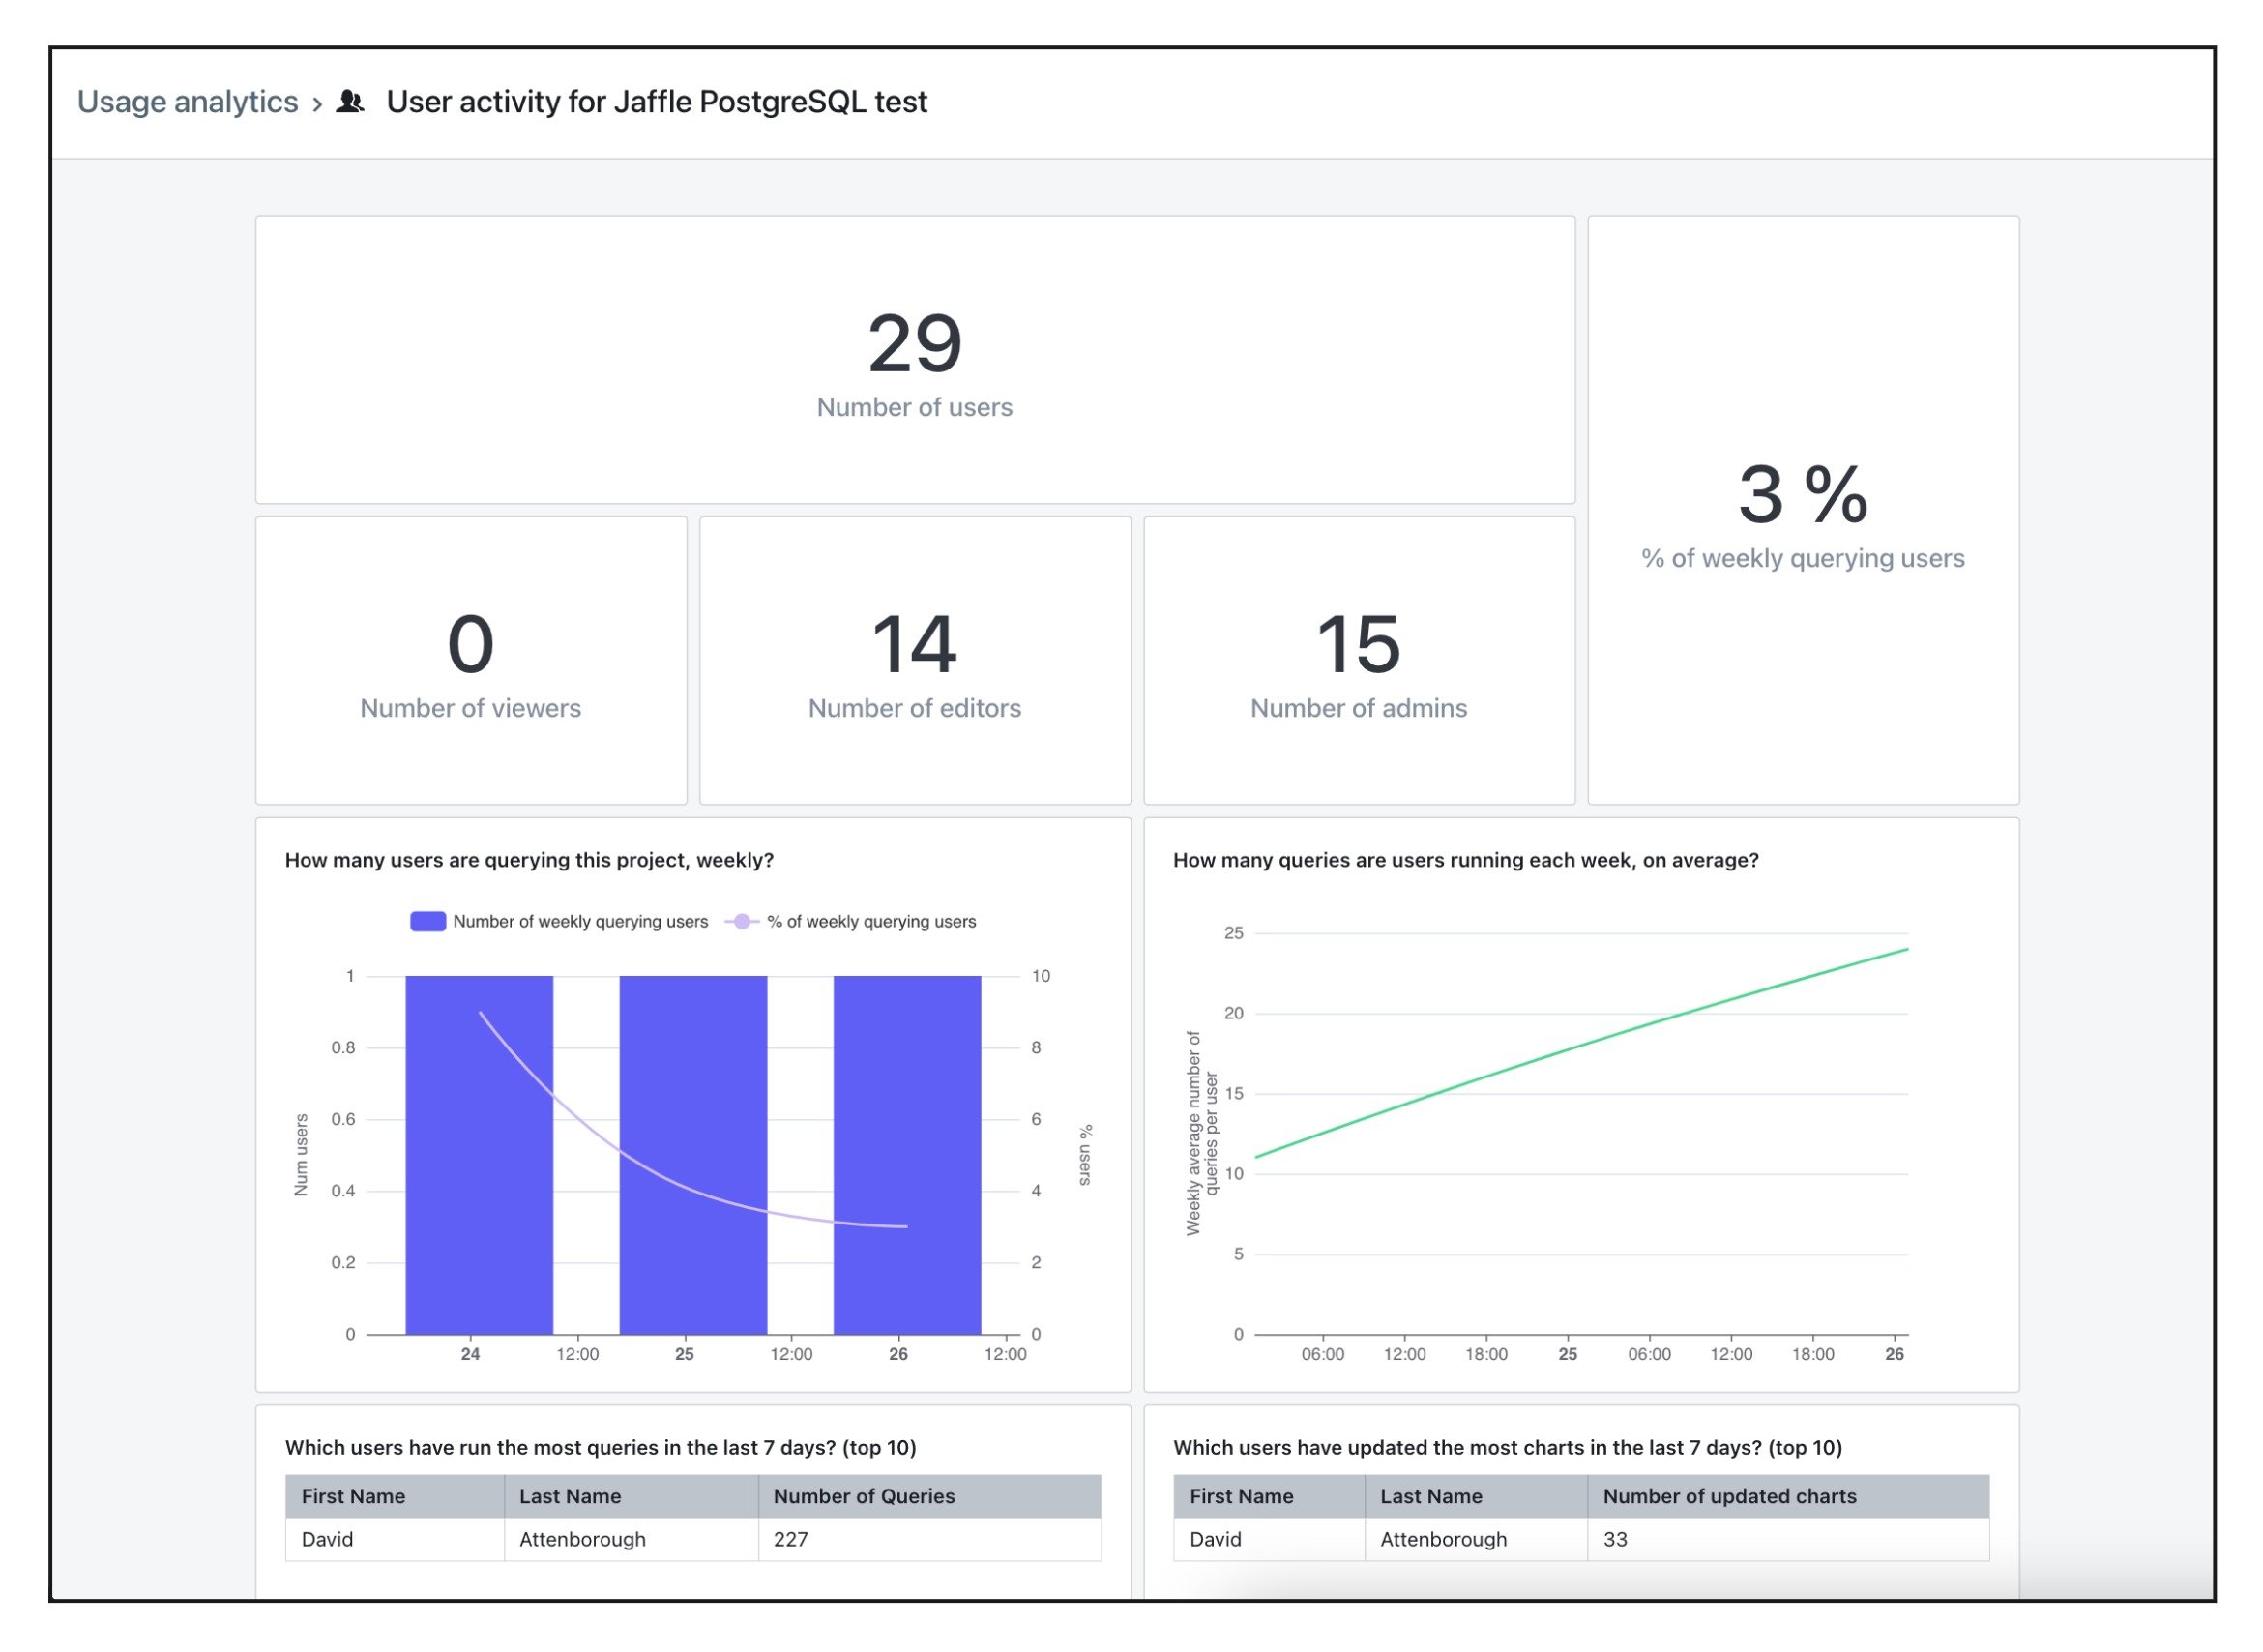 Here's an overview of the fields used in the dashboard:
* **Number of users**: the total number of users that have access to the project.
* **Number of viewers**: the number of users with the `viewer` role that have access to the project.
* **Number of editors**: the number of users with the `editor` role that have access to the project.
* **Number of admins**: the number of users with the `admin` role that have access to the project.
* **% of weekly querying users**: the % of users which have run at least one query in the project in the last 7 days (out of all users in your project). Queries include viewing existing charts and dashboards.
* **Number of weekly querying users**: the number of users which have run at least one query in the project in the last 7 days.
* **Weekly average number of queries per user**: the rolling 7 day average number of queries that each user is running in your project.
* **Users that have run the most queries in the last 7 days**: a list of the users that have run the most queries in your project in the last 7 days.
* **Users that have updated the most charts in the last 7 days**: a list of users that have updated (including created) the most charts in the project in the last 7 days.
* **Users that have not run a query in the last 90 days**: a list of users that have not run a query in the project in the last 7 days. This includes viewing charts and dashboards.
#### Extended usage analytics
Self-hosted instances can set the `EXTENDED_USAGE_ANALYTICS=true` environment variable to add two extra tables to the User Activity dashboard:
* **Dashboard views (top 20)**: ranks dashboards in the project by total view count.
* **Chart views (top 20)**: ranks charts in the project by total view count.
## Query tags
Query tags are metadata which is added to your data warehouse queries and gives you information about each query executed.
The following query tags are sent:
| Query Tag | Detail |
| :----------------- | :------------------------------------------------------------------------------------------------------------------------------------------------------------------------------------------------------------- |
| organization\_uuid | Lightdash organization unique identifier. |
| project\_uuid | Lightdash project unique identifier. |
| user\_uuid | User unique identifier. |
| dashboard\_uuid | Dashboard unique identifier. |
| chart\_uuid | Chart unique identifier. |
| explore\_name | Name of the explore. |
| query\_context | Which context the query was executed in.
Here's an overview of the fields used in the dashboard:
* **Number of users**: the total number of users that have access to the project.
* **Number of viewers**: the number of users with the `viewer` role that have access to the project.
* **Number of editors**: the number of users with the `editor` role that have access to the project.
* **Number of admins**: the number of users with the `admin` role that have access to the project.
* **% of weekly querying users**: the % of users which have run at least one query in the project in the last 7 days (out of all users in your project). Queries include viewing existing charts and dashboards.
* **Number of weekly querying users**: the number of users which have run at least one query in the project in the last 7 days.
* **Weekly average number of queries per user**: the rolling 7 day average number of queries that each user is running in your project.
* **Users that have run the most queries in the last 7 days**: a list of the users that have run the most queries in your project in the last 7 days.
* **Users that have updated the most charts in the last 7 days**: a list of users that have updated (including created) the most charts in the project in the last 7 days.
* **Users that have not run a query in the last 90 days**: a list of users that have not run a query in the project in the last 7 days. This includes viewing charts and dashboards.
#### Extended usage analytics
Self-hosted instances can set the `EXTENDED_USAGE_ANALYTICS=true` environment variable to add two extra tables to the User Activity dashboard:
* **Dashboard views (top 20)**: ranks dashboards in the project by total view count.
* **Chart views (top 20)**: ranks charts in the project by total view count.
## Query tags
Query tags are metadata which is added to your data warehouse queries and gives you information about each query executed.
The following query tags are sent:
| Query Tag | Detail |
| :----------------- | :------------------------------------------------------------------------------------------------------------------------------------------------------------------------------------------------------------- |
| organization\_uuid | Lightdash organization unique identifier. |
| project\_uuid | Lightdash project unique identifier. |
| user\_uuid | User unique identifier. |
| dashboard\_uuid | Dashboard unique identifier. |
| chart\_uuid | Chart unique identifier. |
| explore\_name | Name of the explore. |
| query\_context | Which context the query was executed in.
For queries in:
- dashboards use `dashboardView`
- explore use `exploreView`
- chart use `chartView`
- sql chart use `sqlChartView` |
Query tags are stored differently in each data warehouse:
| Data Warehouse | Query Tag |
| :------------- | :--------------------------------------------------------------------------------------------------------------------------------------------------------- |
| BigQuery | Writes metadata as labels in your [job history](https://cloud.google.com/bigquery/docs/managing-jobs#view%5Fjob%5Fdetails%5F2). |
| Snowflake | Writes JSON metadata in the comment column of your [query history](https://docs.snowflake.com/en/user-guide/ui-history#viewing-query-details-and-results). |
| ClickHouse | Writes JSON metadata in the comment column of your [query log](https://clickhouse.com/docs/operations/system-tables/query_log). |
| Trino | Appends JSON metadata as a SQL comment in each submitted SQL query. |
| Redshift | Appends JSON metadata as a SQL comment in each submitted SQL query. |
| Databricks | Appends JSON metadata as a SQL comment in each submitted SQL query. |
| Postgres | Appends JSON metadata as a SQL comment in each submitted SQL query. |
| Athena | Appends JSON metadata as a SQL comment in each submitted SQL query. |