> ## Documentation Index
> Fetch the complete documentation index at: https://lightdash-mintlify-cccf65ca.mintlify.site/llms.txt
> Use this file to discover all available pages before exploring further.
# Using Filters
> Filters appear at the top of the Explore view or dashboard and allow users to change the data being pulled into your charts.
For example, if I built a chart showing the revenue over time, but I wanted it to only have the revenue I made in France, I could add a filter for `country is equal to France`.
You can [add filters to your charts individually in the Explore view](#adding-filters-in-the-explore-view), or [across all of your charts in your dashboard](#adding-filters-to-your-dashboard). Don't worry, we'll walk you through both and you'll be a filter pro in no time!
If you're a developer, you can add permanent filters to tables using the `sql_filter` yaml option. For more information see [Table configuration](/references/tables#sql-filter)
## General filters tips
Here are some general tips about filters that apply to using them in both the Explore view and in dashboards.
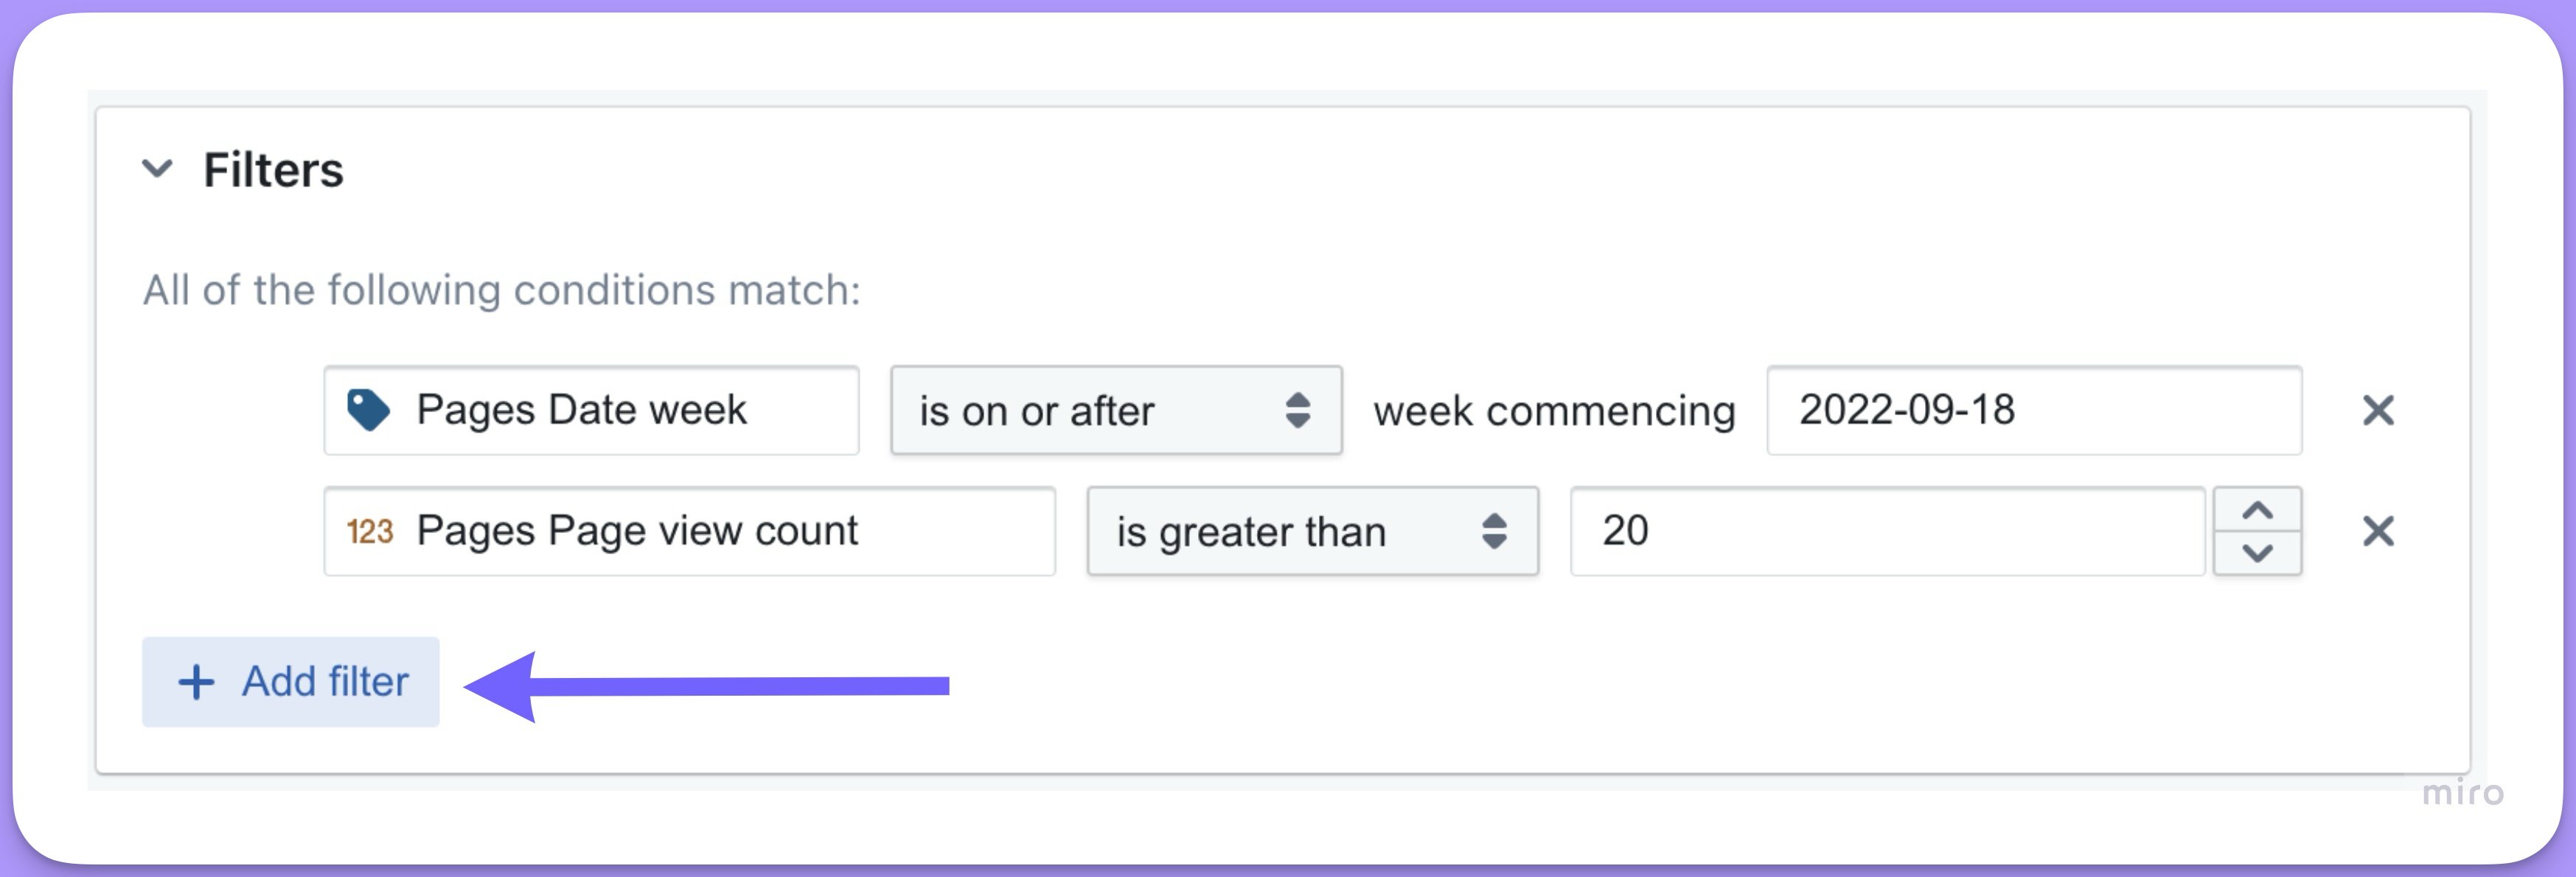
### If you want to have multiple filters, just click `+ Add filter`
In the Explore view:
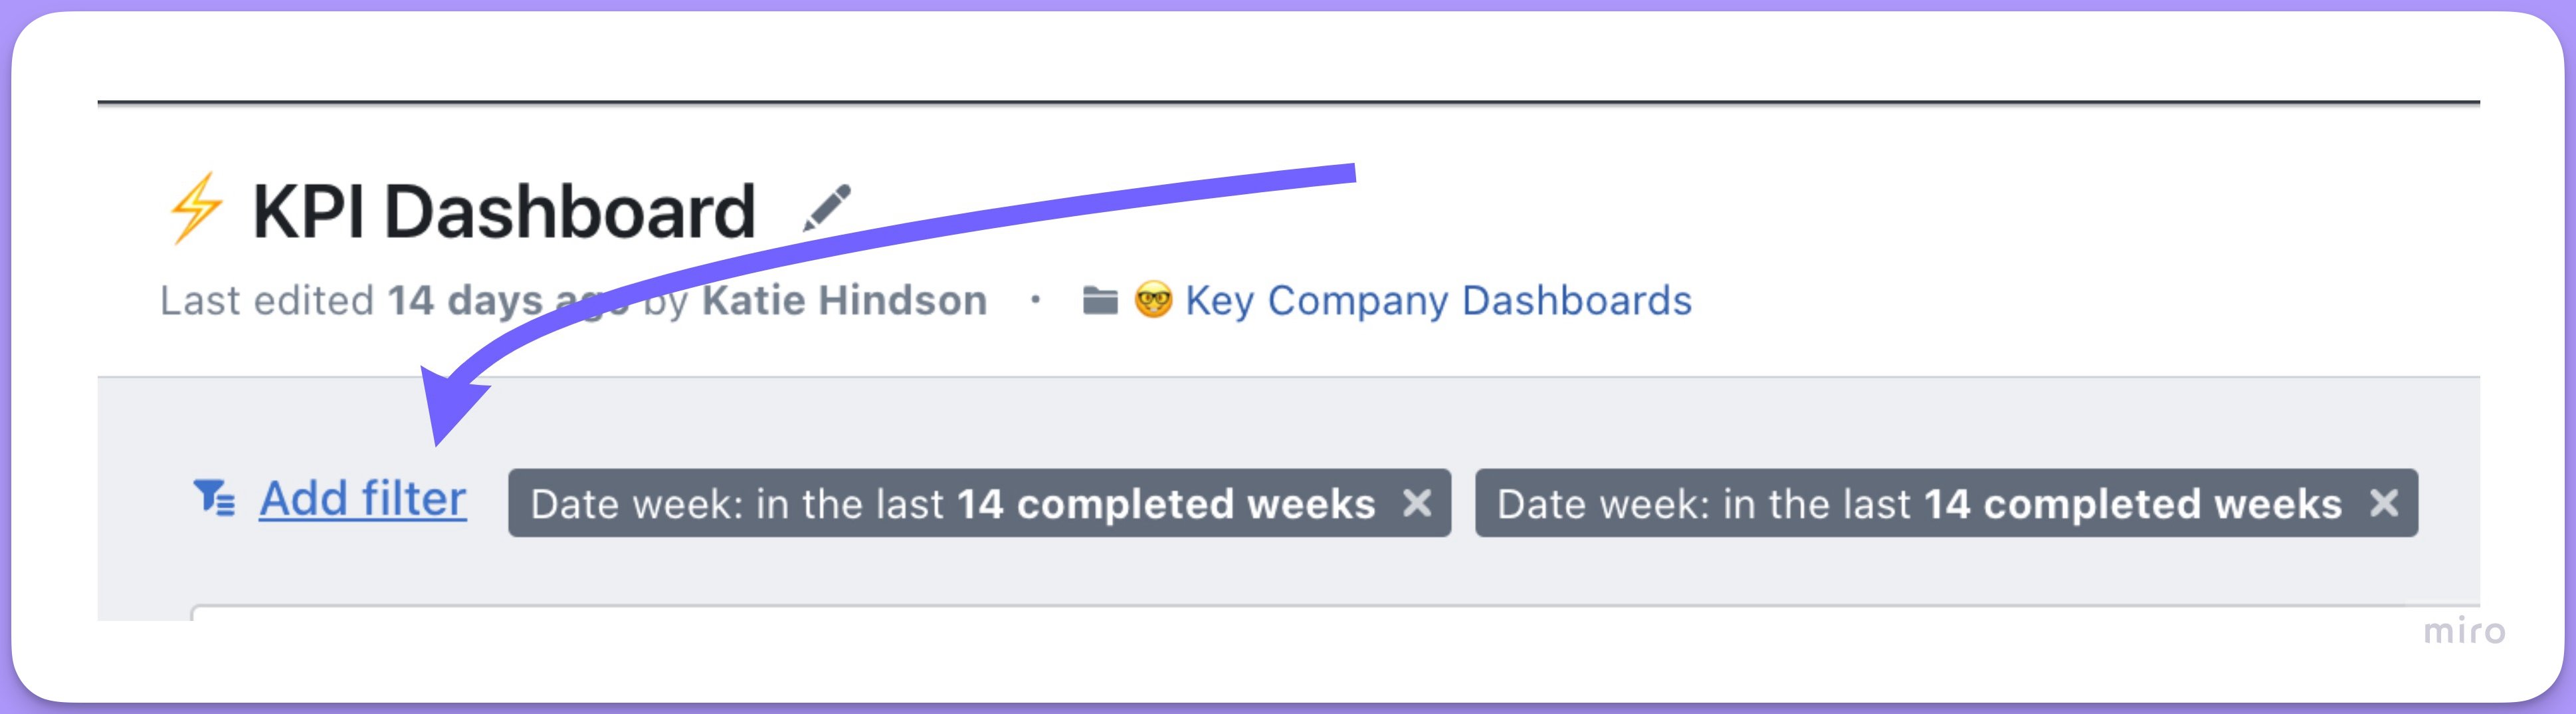
 Or in a dashboard:
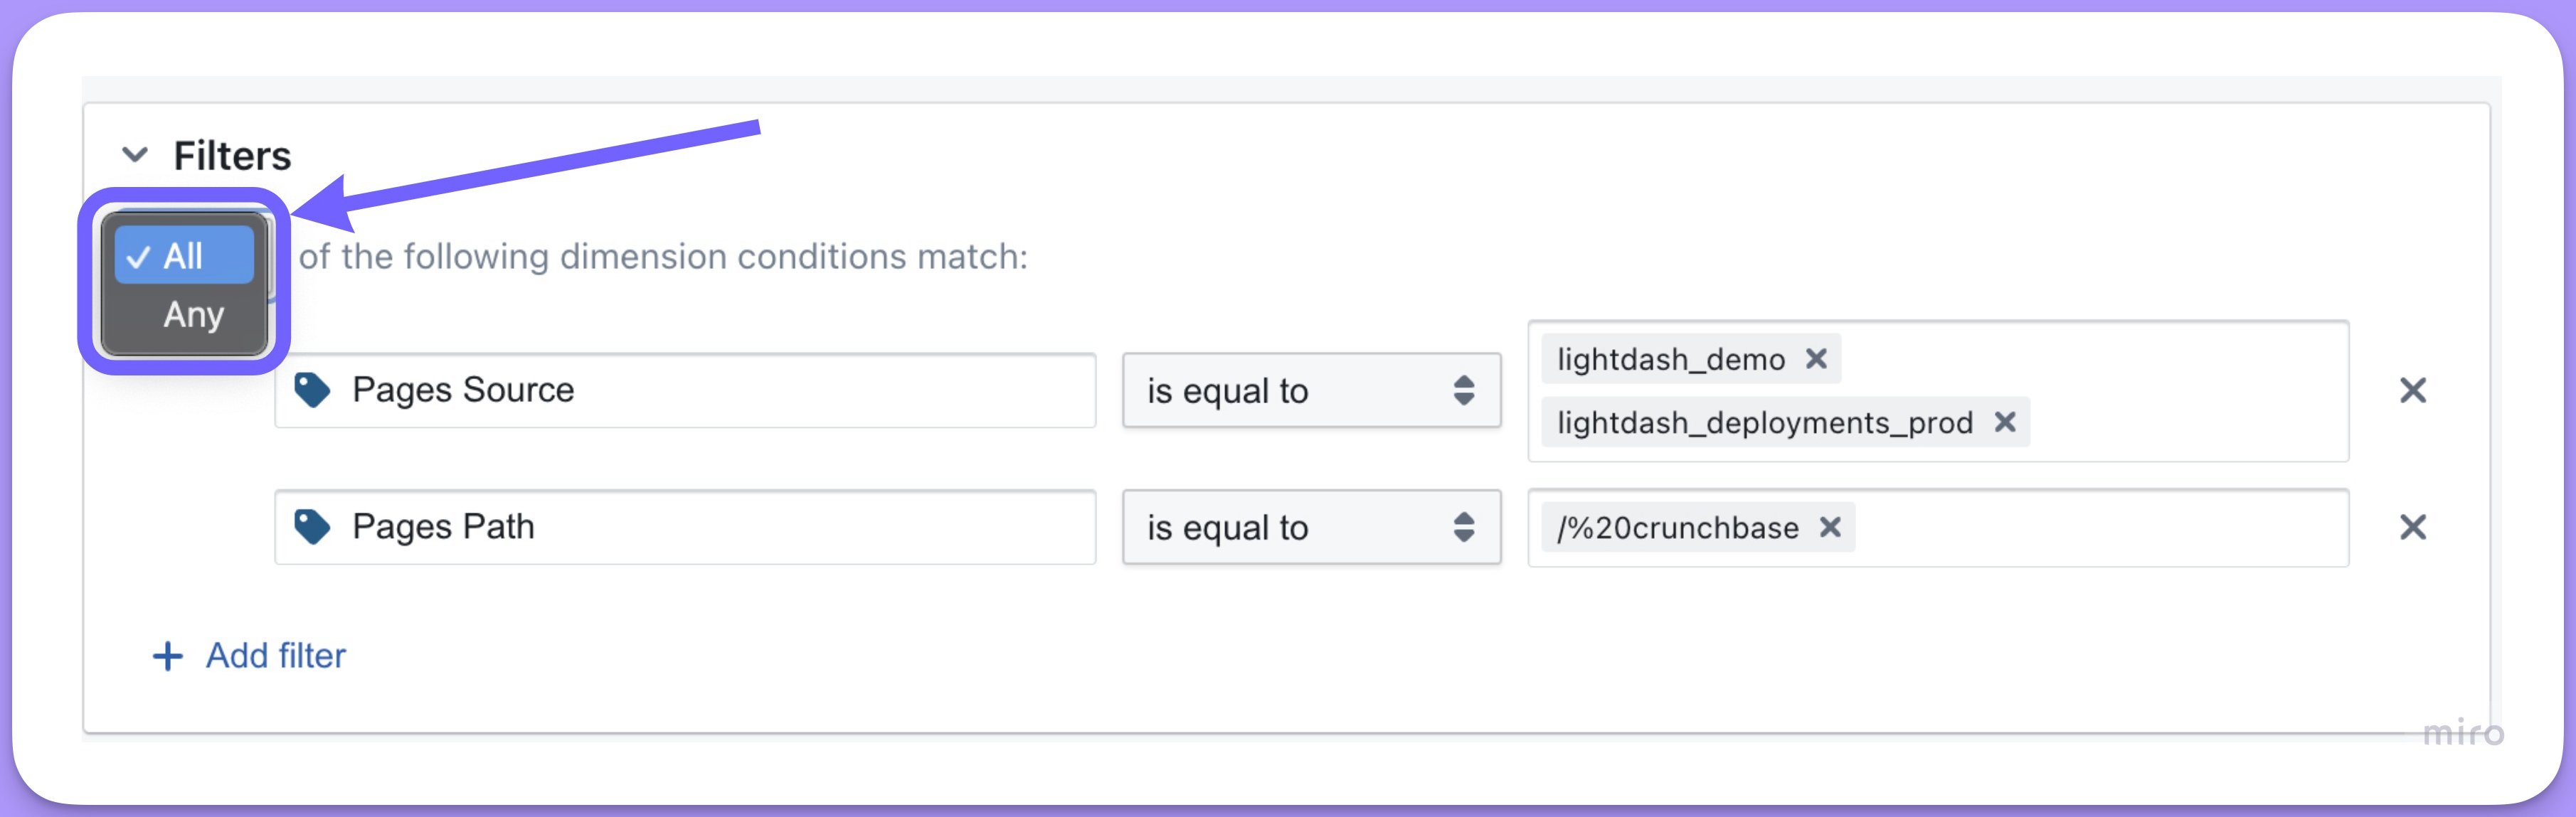
 ### If you add multiple filters, you can choose to have `ALL` or `ANY` of the conditions match
To choose which option you want, just click on the drop-down menu on the top-left of the filters.
### If you add multiple filters, you can choose to have `ALL` or `ANY` of the conditions match
To choose which option you want, just click on the drop-down menu on the top-left of the filters.
 Selecting `ALL` conditions to match means you'd add an `AND` between your conditions in SQL. So, the example in the Explore view above would give us compiled SQL that looks like:
```sql theme={null}
WHERE (
(pages.source) IN ('lightdash_demo', 'lightdash_documentation')
AND (pages.path) = '/20%crunchbase'
```
Selecting `ANY` conditions to match means you'd add an `OR` between your conditions in SQL. So, the example in the Explore view above would give us compiled SQL that looks like:
```sql theme={null}
WHERE (
(pages.source) IN ('lightdash_demo', 'lightdash_documentation')
OR (pages.path) = '/20%crunchbase'
```
### If you want to include multiple values in your filter, just hit `enter` between each value entry in your list
Selecting `ALL` conditions to match means you'd add an `AND` between your conditions in SQL. So, the example in the Explore view above would give us compiled SQL that looks like:
```sql theme={null}
WHERE (
(pages.source) IN ('lightdash_demo', 'lightdash_documentation')
AND (pages.path) = '/20%crunchbase'
```
Selecting `ANY` conditions to match means you'd add an `OR` between your conditions in SQL. So, the example in the Explore view above would give us compiled SQL that looks like:
```sql theme={null}
WHERE (
(pages.source) IN ('lightdash_demo', 'lightdash_documentation')
OR (pages.path) = '/20%crunchbase'
```
### If you want to include multiple values in your filter, just hit `enter` between each value entry in your list
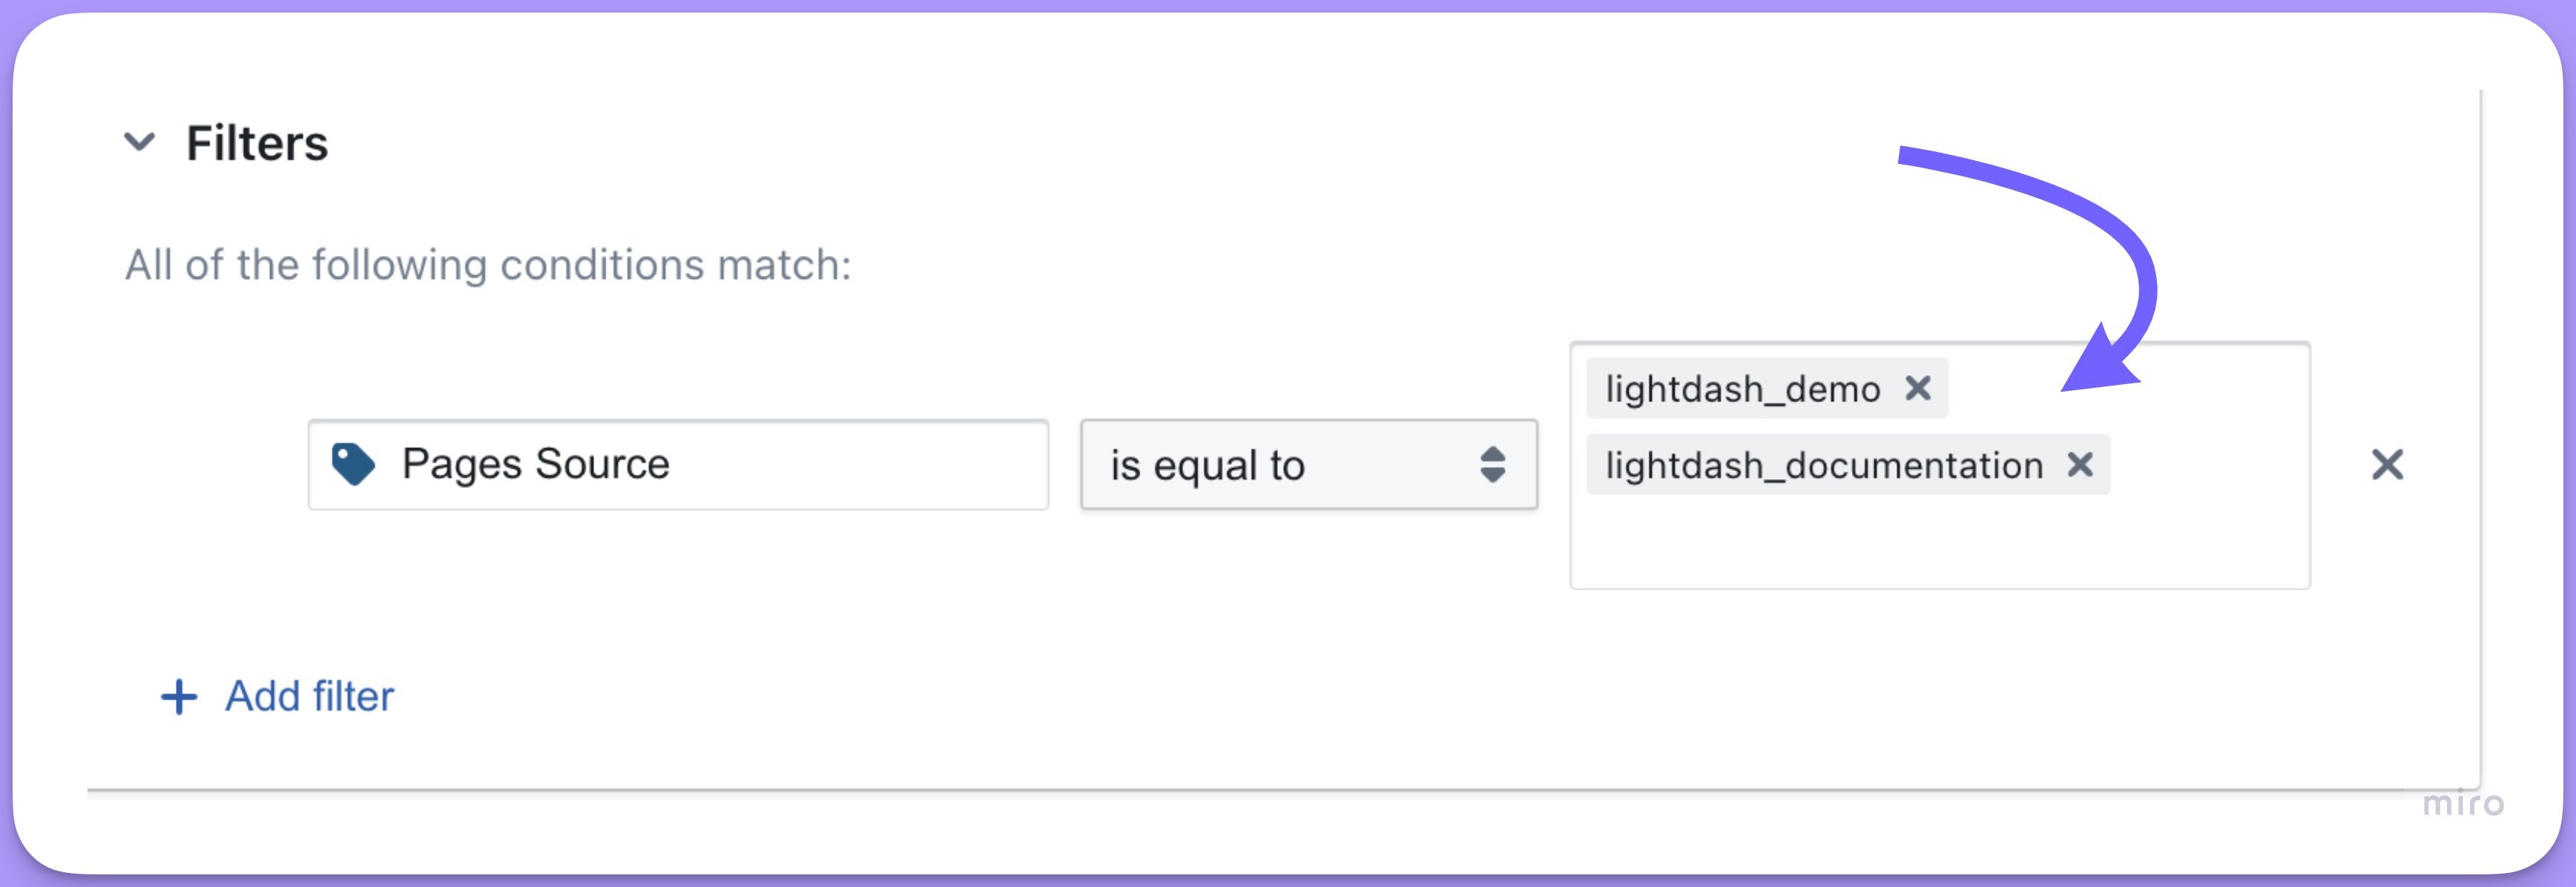 The listed values are separated by an OR statement in the compiled SQL. E.g. the above would give us:
```sql theme={null}
WHERE (
(pages.source) = 'lightdash_demo'
OR (pages.source) = 'lightdash_documentation'
)
```
### Upload a CSV to add multiple filter values
If you need to add a long list of values to a string filter, you can upload a CSV file instead of entering each value manually. This is useful when you have hundreds or thousands of values to filter by (e.g., a list of customer IDs or product SKUs).
To upload a CSV:
1. Open the filter dropdown for a string field
2. Click the **Upload CSV** button
3. Select a CSV file containing your filter values (one value per row, or a single column)
4. The values from your CSV will be added to the filter
### To learn about the types of filters we have available, check out the filters reference doc.
Check out our [filters reference doc here](/guides/filters) to see a list of all available filters and their uses.
## Adding filters in the Explore view
There are a couple of ways that you can add filters in the Explore view.
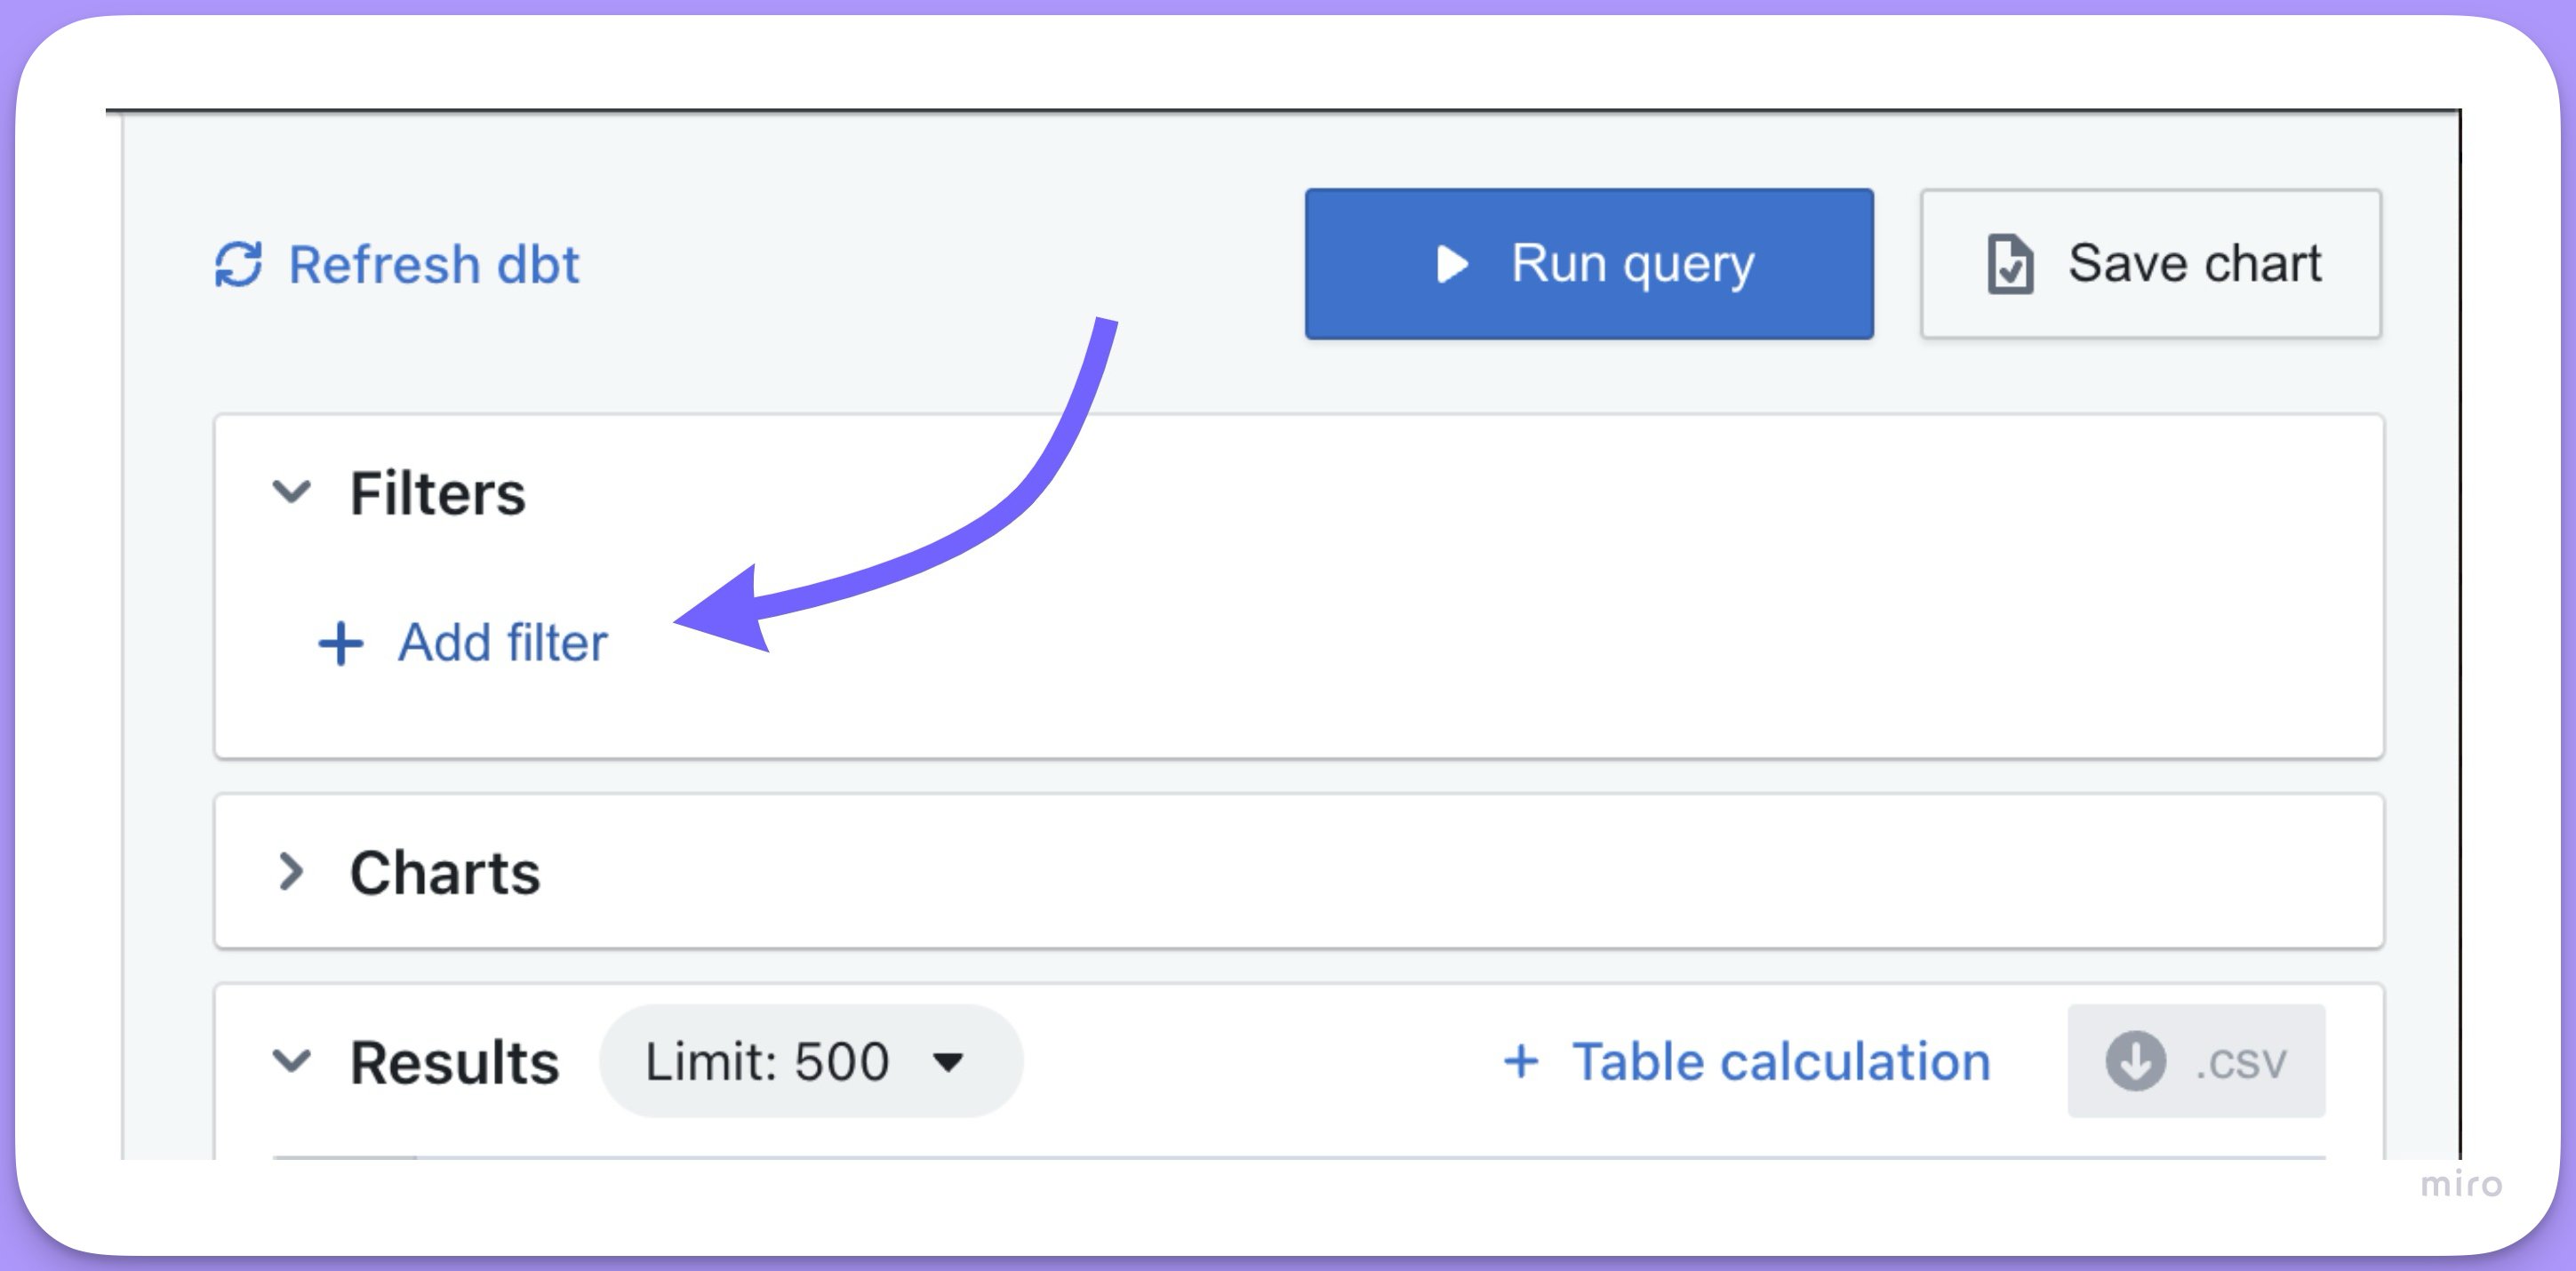
### Adding a filter from within the `Filters` tab
In the Explores view, you can add filters from within the `Filters` tab. Just click to open the toggle, then click `add filter`.
The listed values are separated by an OR statement in the compiled SQL. E.g. the above would give us:
```sql theme={null}
WHERE (
(pages.source) = 'lightdash_demo'
OR (pages.source) = 'lightdash_documentation'
)
```
### Upload a CSV to add multiple filter values
If you need to add a long list of values to a string filter, you can upload a CSV file instead of entering each value manually. This is useful when you have hundreds or thousands of values to filter by (e.g., a list of customer IDs or product SKUs).
To upload a CSV:
1. Open the filter dropdown for a string field
2. Click the **Upload CSV** button
3. Select a CSV file containing your filter values (one value per row, or a single column)
4. The values from your CSV will be added to the filter
### To learn about the types of filters we have available, check out the filters reference doc.
Check out our [filters reference doc here](/guides/filters) to see a list of all available filters and their uses.
## Adding filters in the Explore view
There are a couple of ways that you can add filters in the Explore view.
### Adding a filter from within the `Filters` tab
In the Explores view, you can add filters from within the `Filters` tab. Just click to open the toggle, then click `add filter`.
 Select the field you would like to filter from the drop-down list, then select the filtering options.
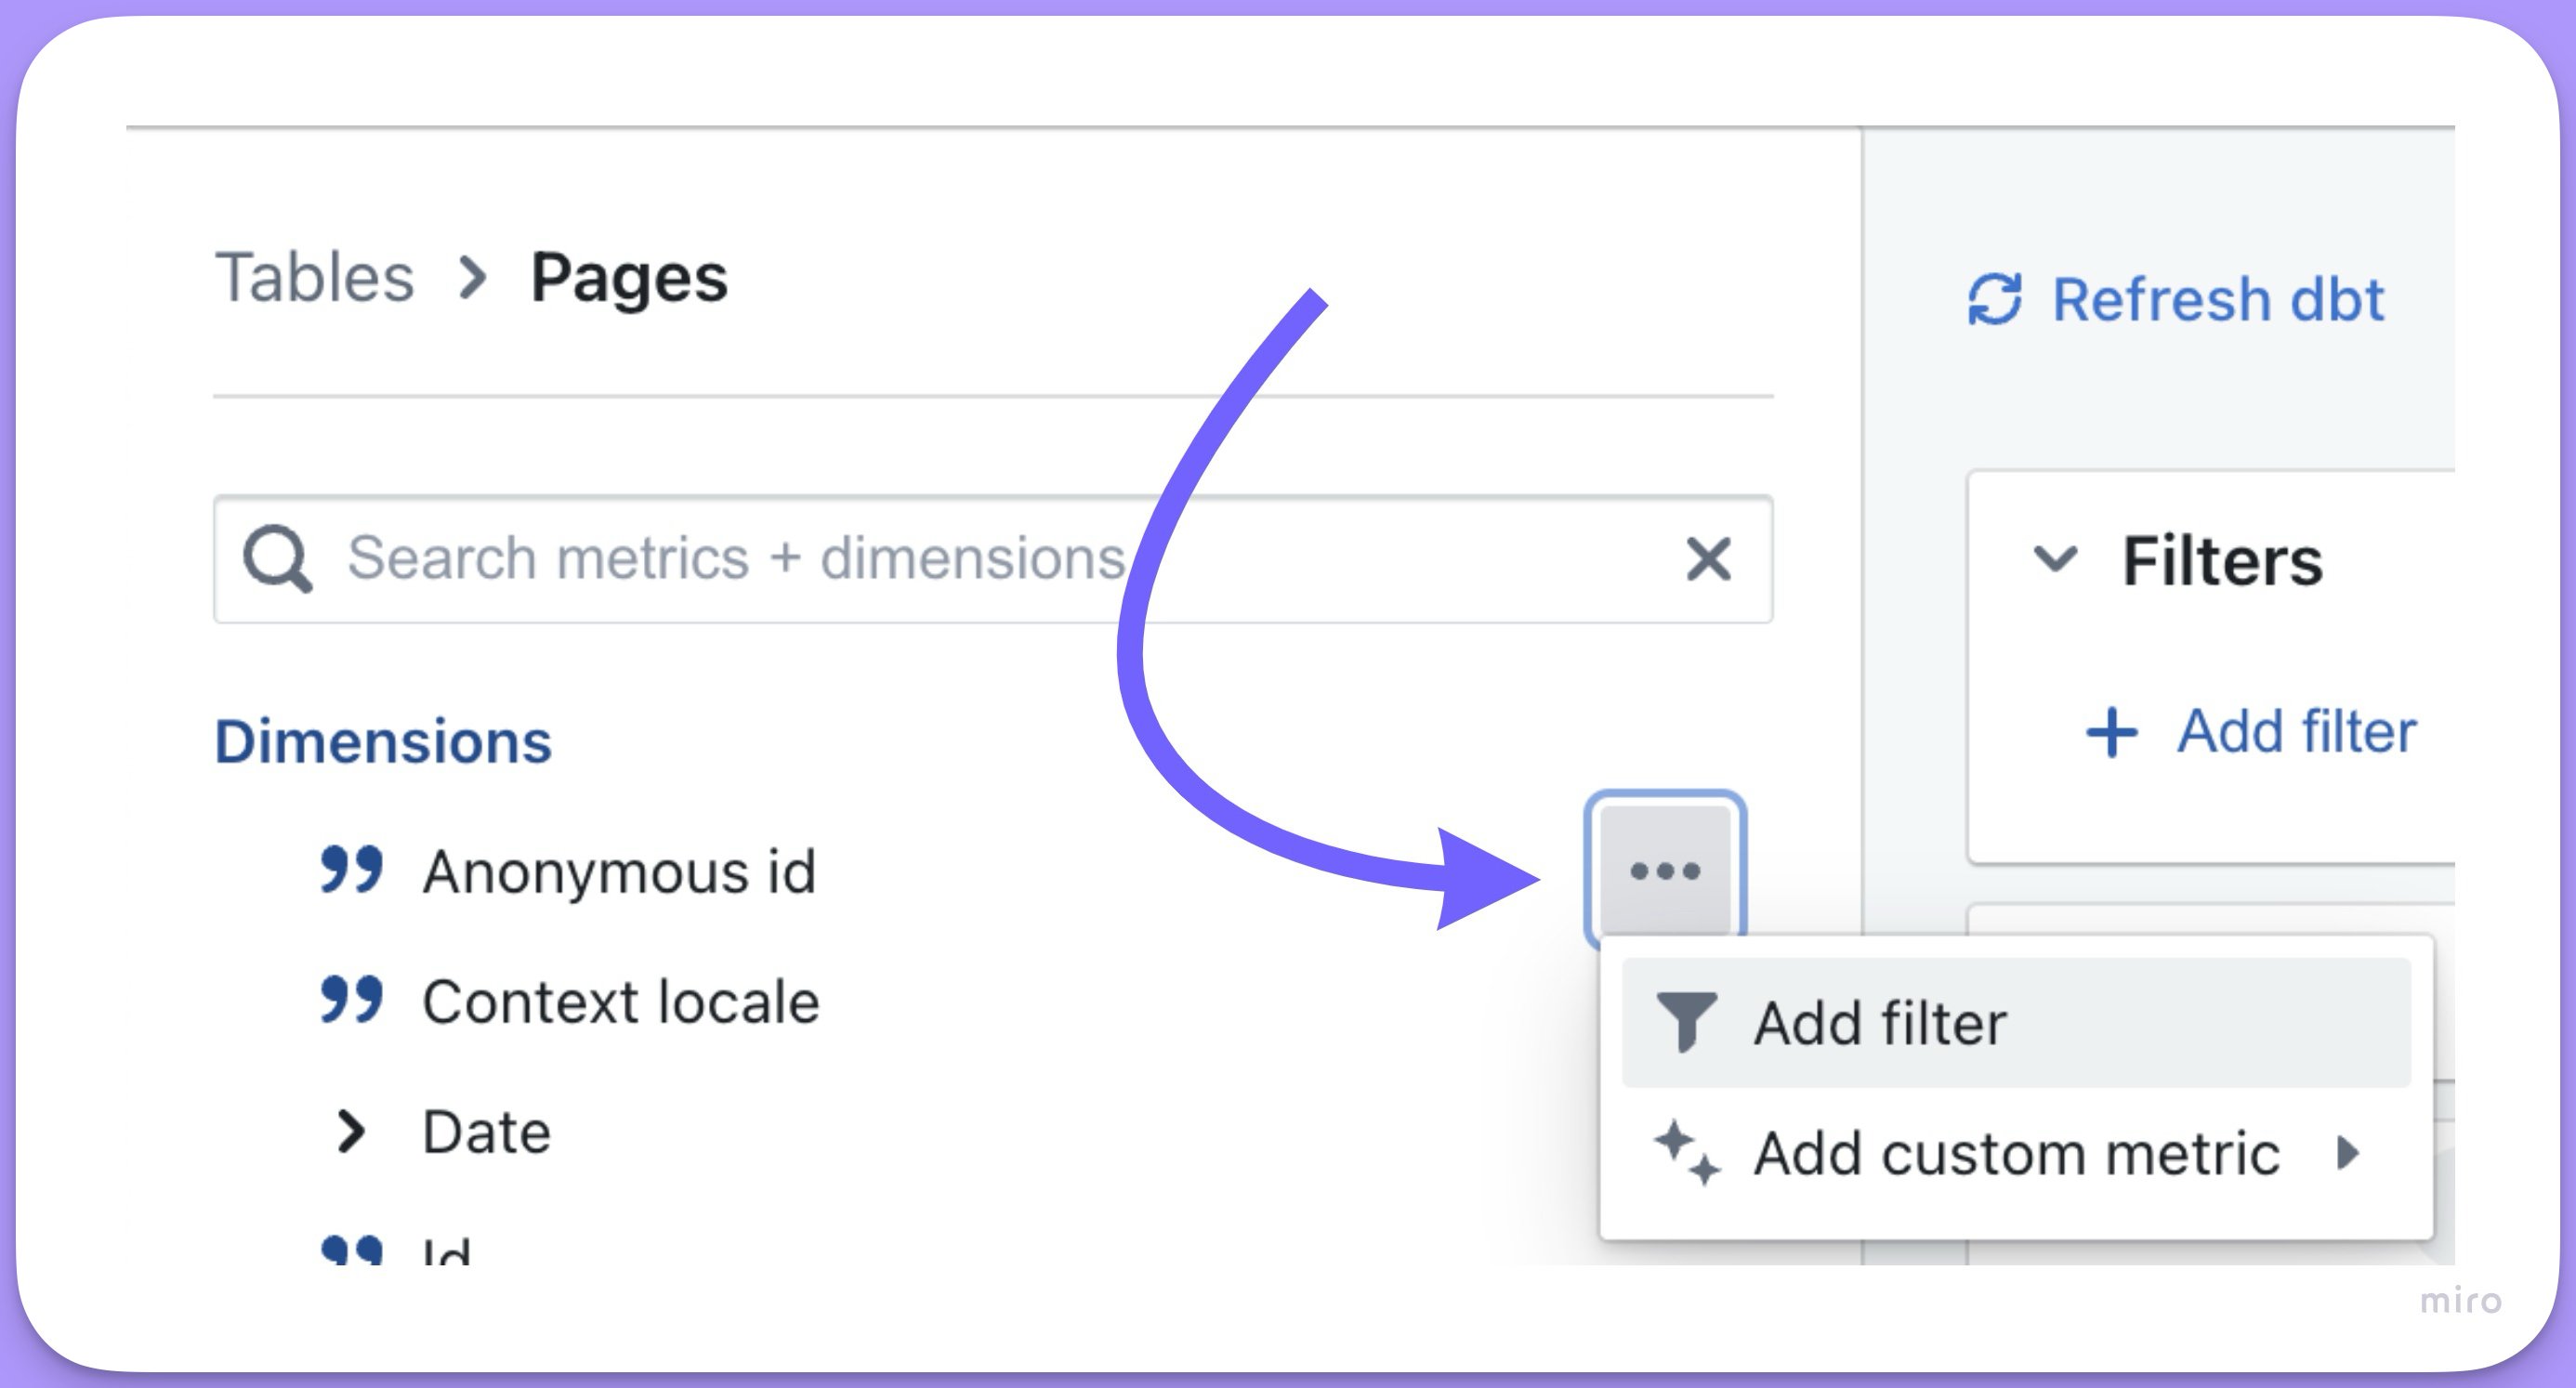
### Adding a filter from the sidebar
It's easy to add filters directly from the list of fields in the sidebar. Just click on the `options` for a field, then click `add filter`.
Select the field you would like to filter from the drop-down list, then select the filtering options.
### Adding a filter from the sidebar
It's easy to add filters directly from the list of fields in the sidebar. Just click on the `options` for a field, then click `add filter`.
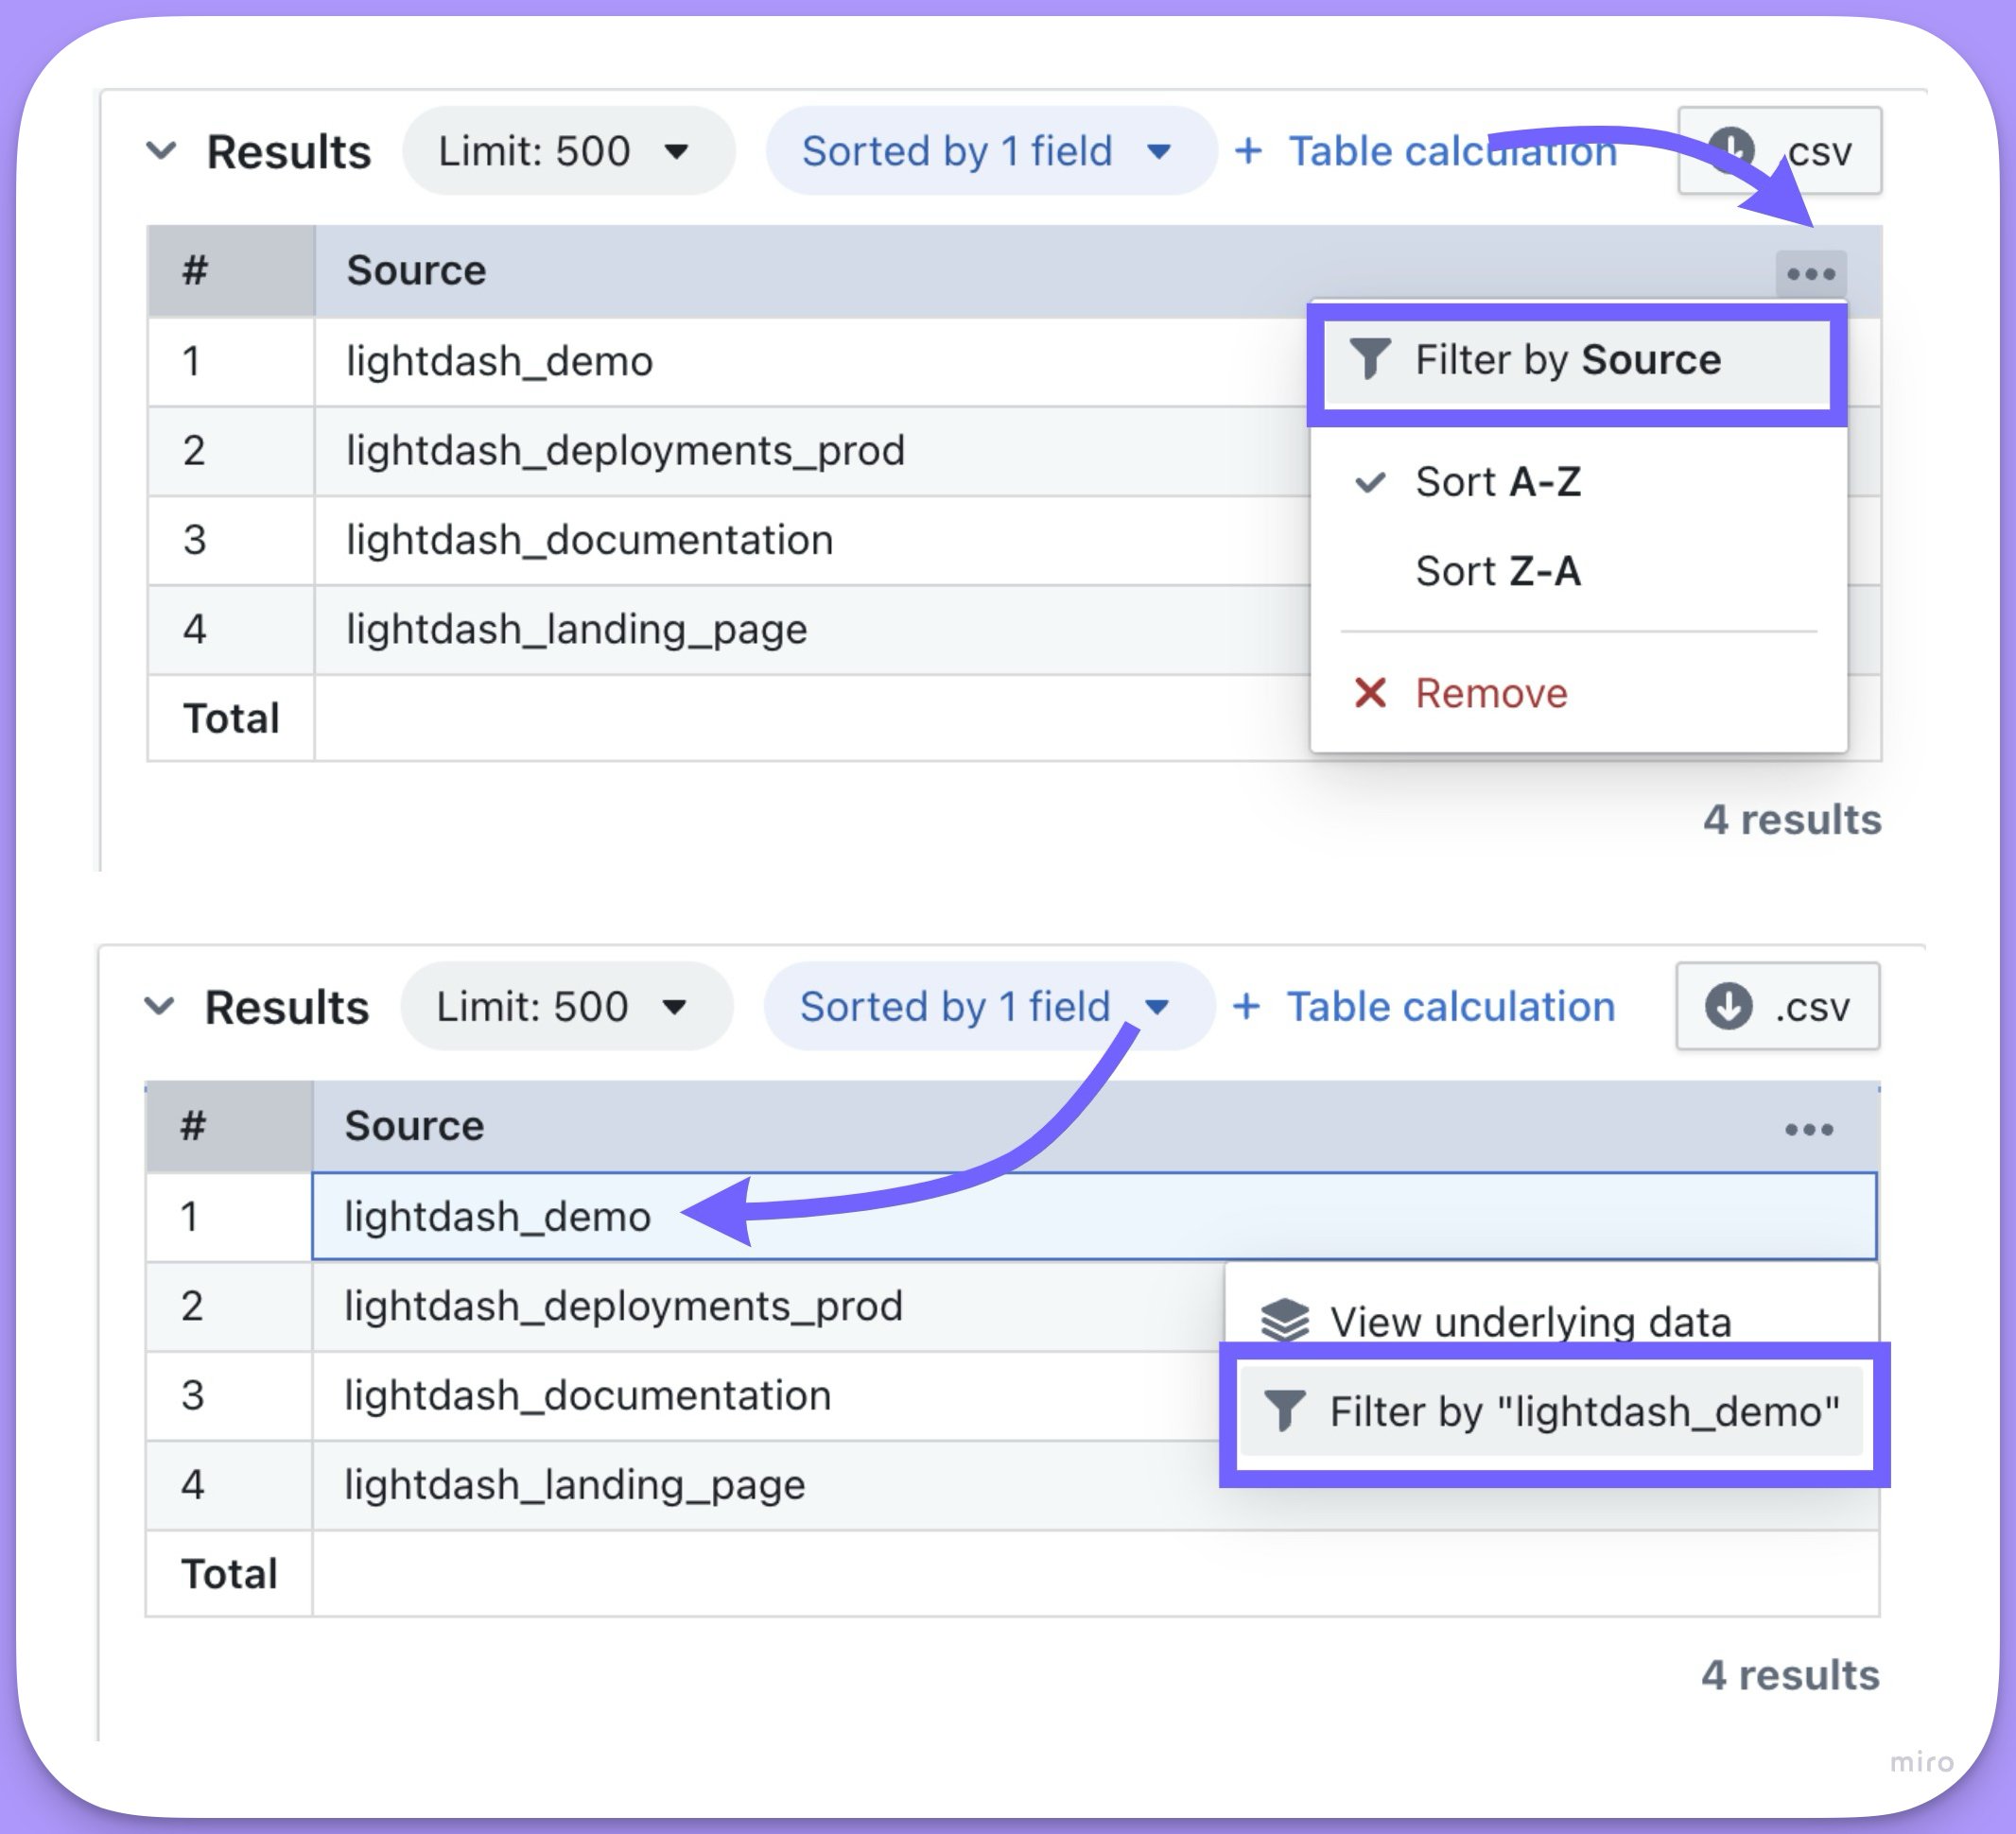
 ### Adding a filter from the results table
Once you have some results in your results table, you can add filters by clicking on the three-dot menu of the column you want to filter on, or by clicking on the value you want to filter by.
### Adding a filter from the results table
Once you have some results in your results table, you can add filters by clicking on the three-dot menu of the column you want to filter on, or by clicking on the value you want to filter by.
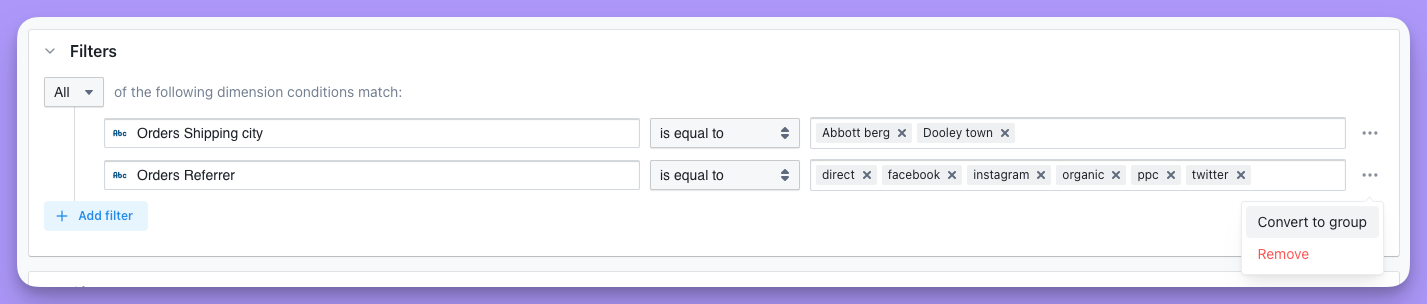
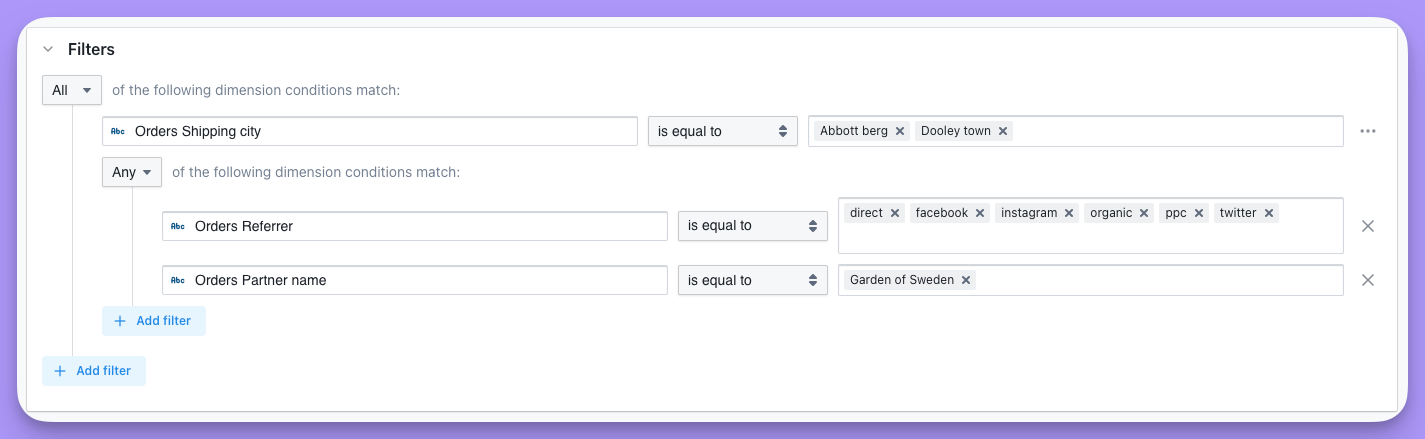
 ### Adding nested filters
You can add nested filters by clicking on the options button on the right-hand side of the filter and then click on `convert to group`.
### Adding nested filters
You can add nested filters by clicking on the options button on the right-hand side of the filter and then click on `convert to group`.
 Then, you can add a new filter to the nested filter by clicking `add filter`.
 ## Adding filters to your dashboard
There are a couple of ways that you can add filters to your Dashboards.
### Adding temporary filters to your dashboard
If you add a temporary filter to your dasboard, then only you will see the filters you've applied (you won't be changing the dashboard for everyone who comes to look at it). If you want to save the dashboard filters you're adding, then check out [adding saved filters to your dashboard](#adding-saved-filters-to-your-dashboard).
There are two ways to add temporary filters to your dashboard.
If you want to restrict access to temporary filters, you can hide the `Add filters` button on a dashboard. Head to edit mode and toggle the **eye icon** next to the `Add filters` dropdown to hide or show it. When hidden, end users are restricted to only using filters that have been specifically set up in dashboard edit mode.
##### Adding temporary filters using the `add filters` button
1. Open up your dashboard.
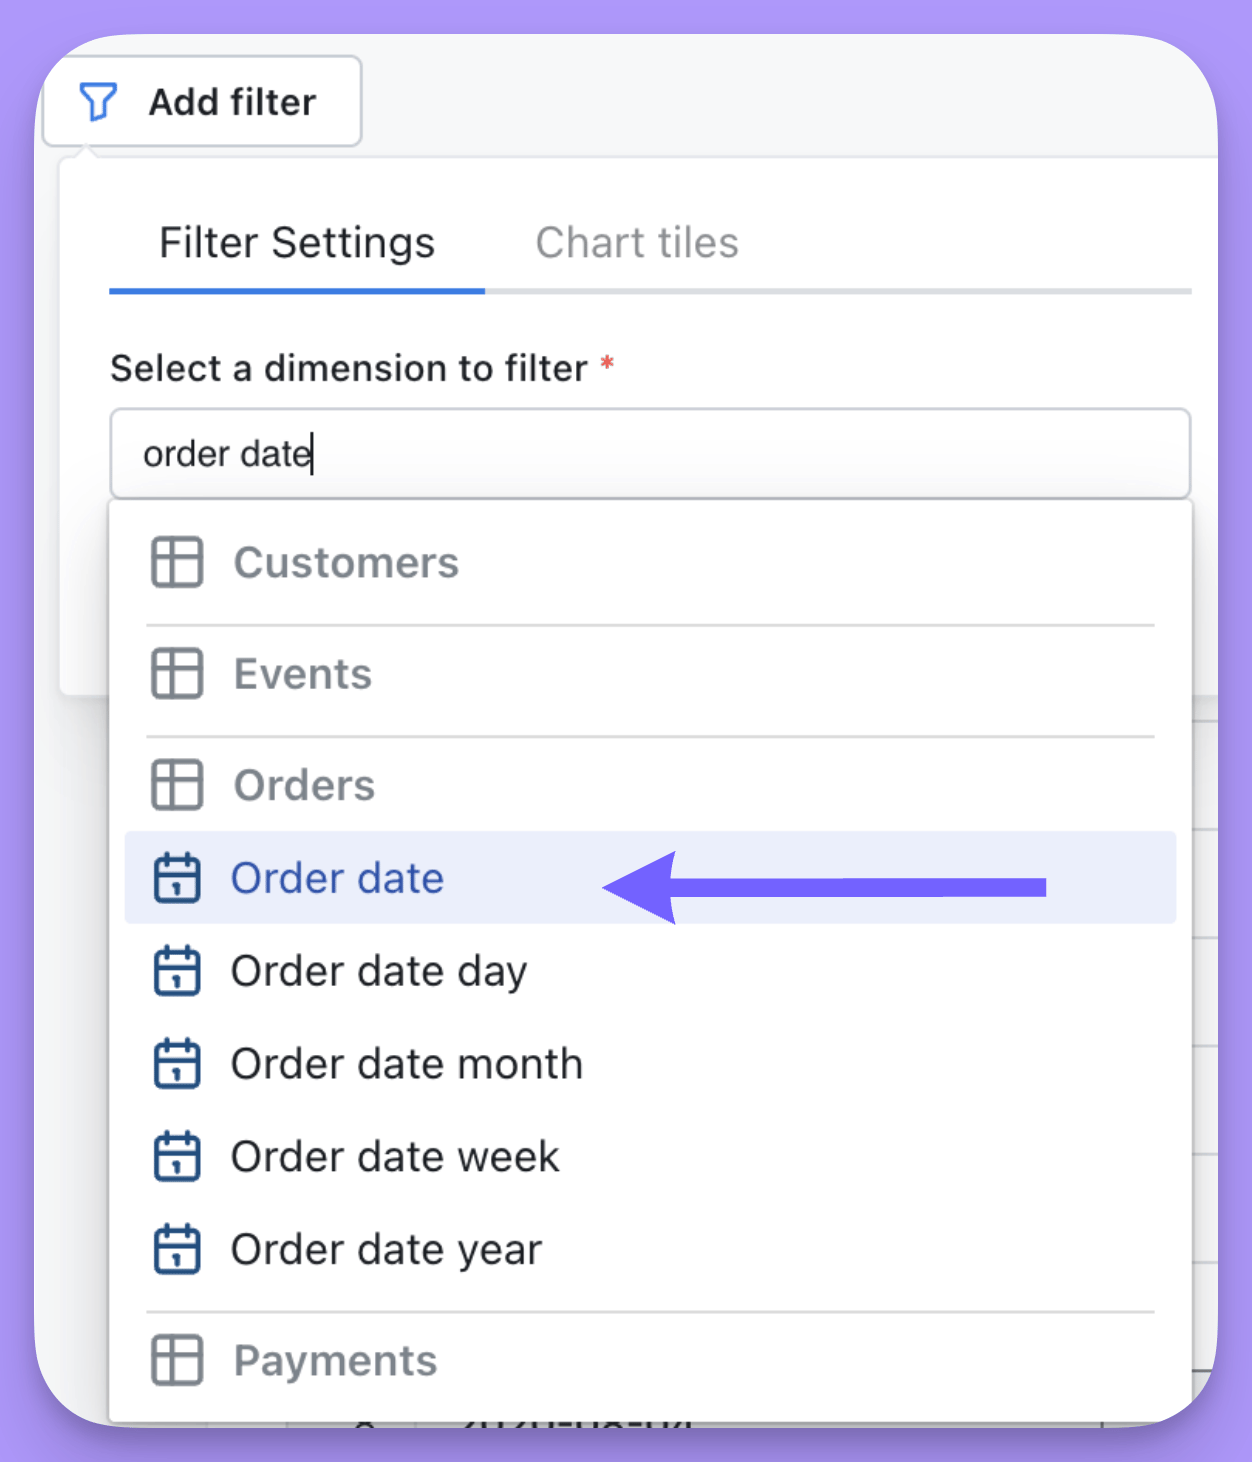
2. Click `add filter`, then specify the field that you want to filter on and the value you want to filter by.
## Adding filters to your dashboard
There are a couple of ways that you can add filters to your Dashboards.
### Adding temporary filters to your dashboard
If you add a temporary filter to your dasboard, then only you will see the filters you've applied (you won't be changing the dashboard for everyone who comes to look at it). If you want to save the dashboard filters you're adding, then check out [adding saved filters to your dashboard](#adding-saved-filters-to-your-dashboard).
There are two ways to add temporary filters to your dashboard.
If you want to restrict access to temporary filters, you can hide the `Add filters` button on a dashboard. Head to edit mode and toggle the **eye icon** next to the `Add filters` dropdown to hide or show it. When hidden, end users are restricted to only using filters that have been specifically set up in dashboard edit mode.
##### Adding temporary filters using the `add filters` button
1. Open up your dashboard.
2. Click `add filter`, then specify the field that you want to filter on and the value you want to filter by.
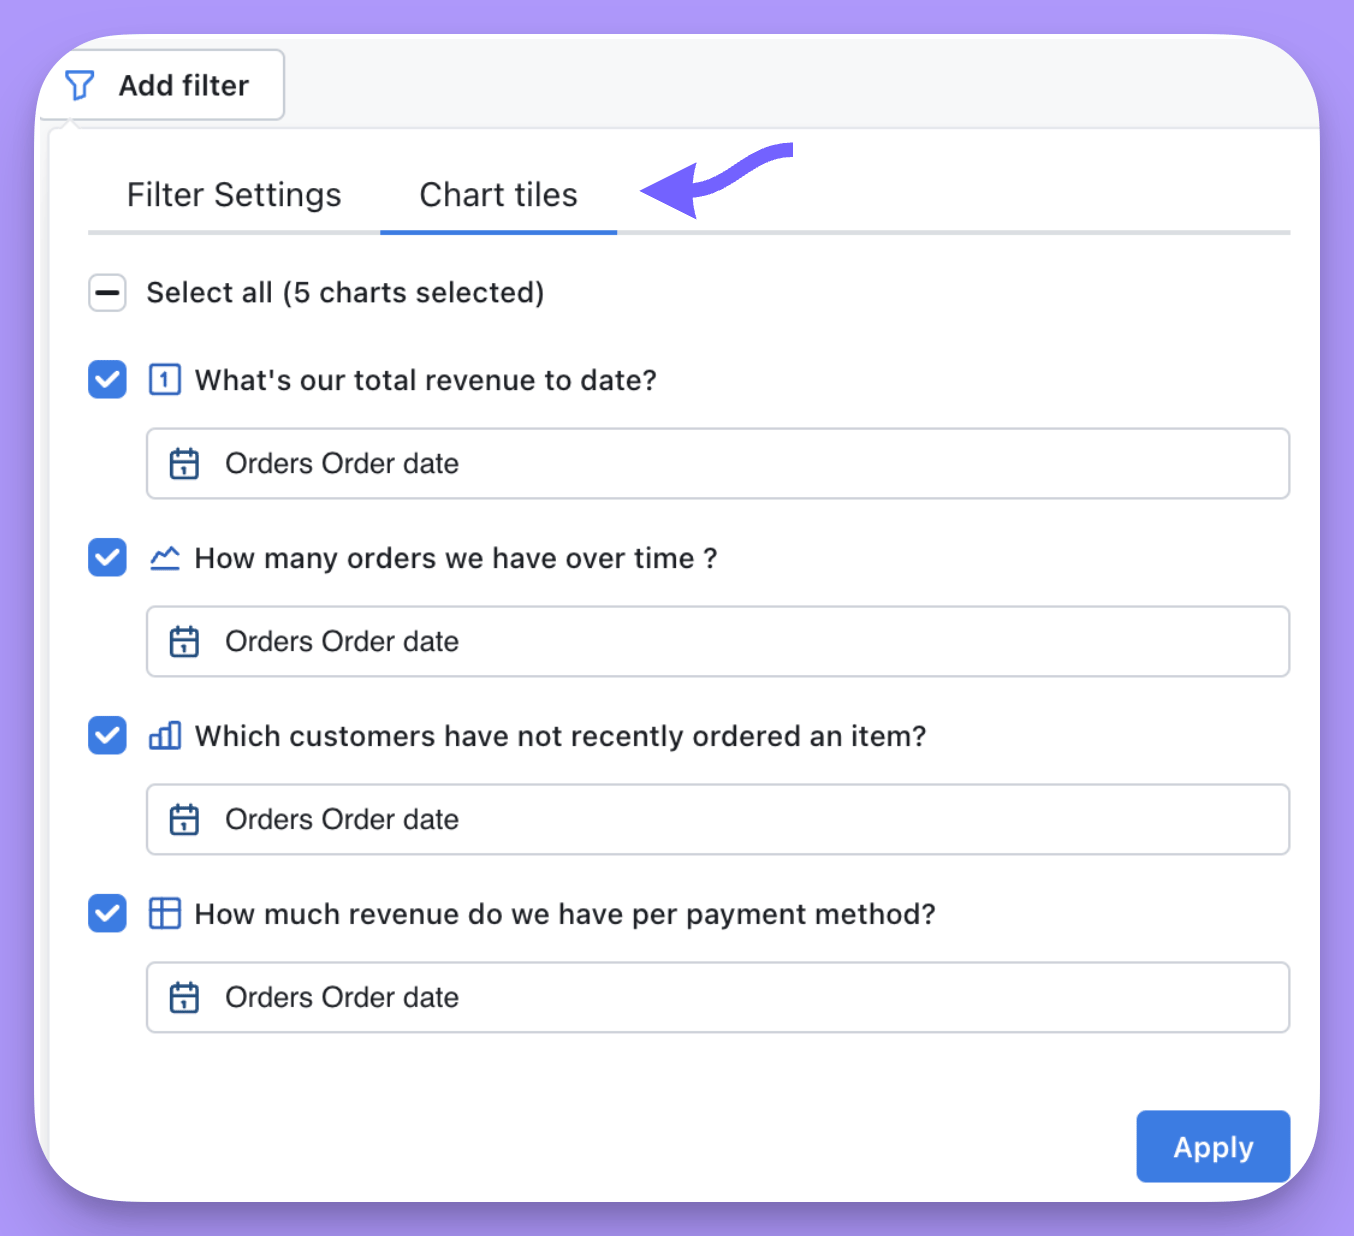
 3. If you want, you can adjust which tiles the filter is applied to by clicking on the `Tiles` tab.
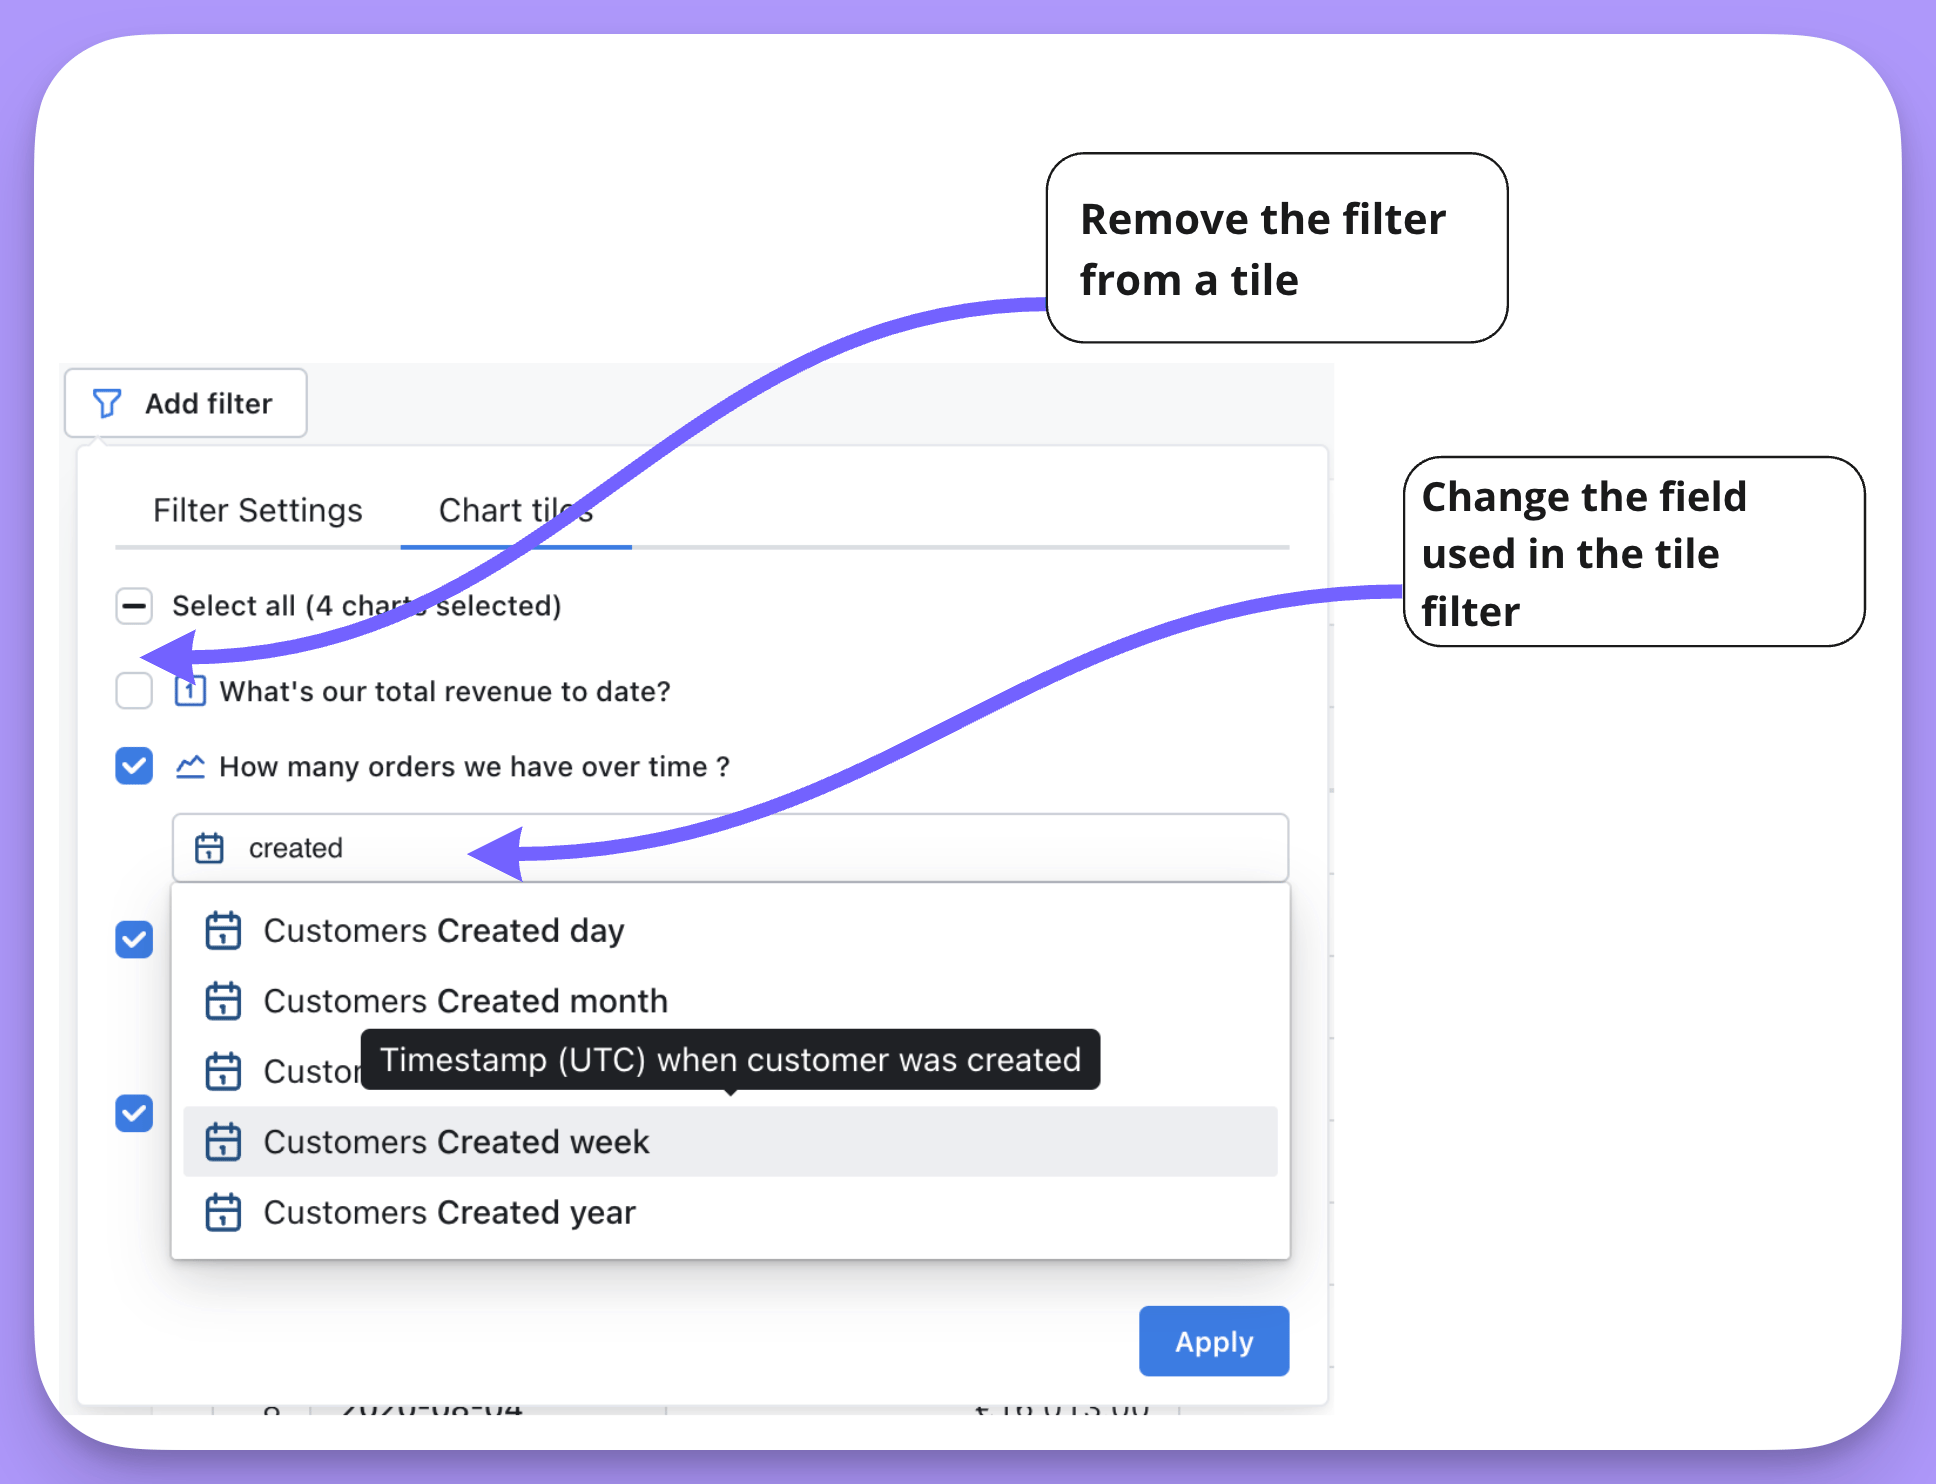
 You can remove the filter from a certain tile, or you can change which field the filter is applied to in a tile.
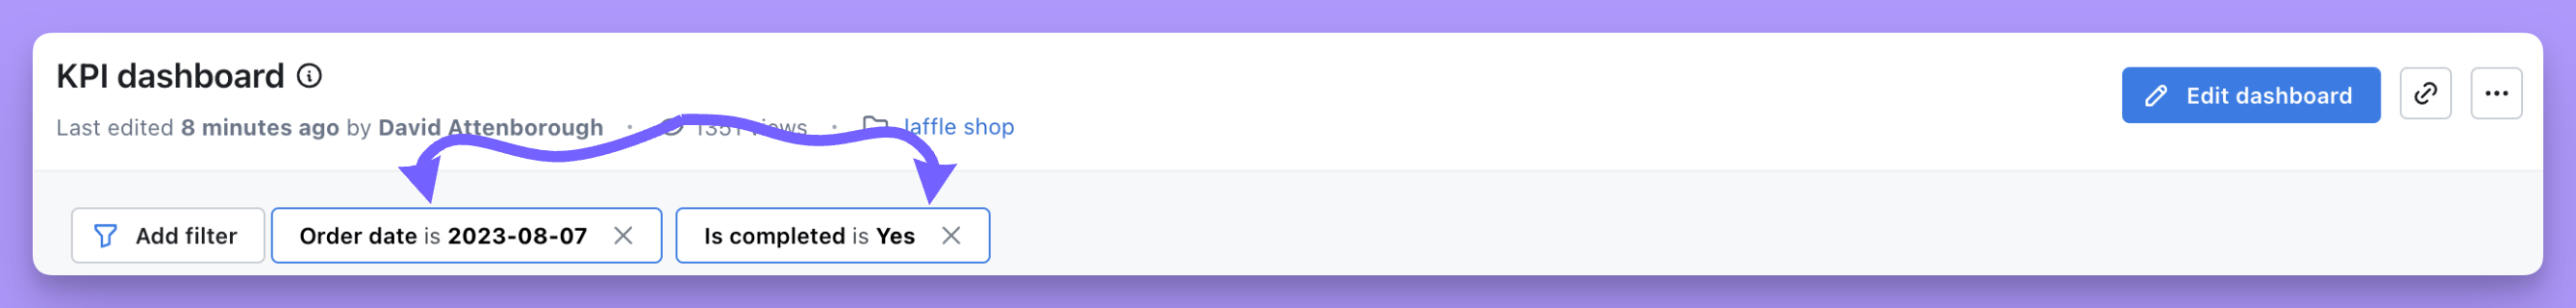
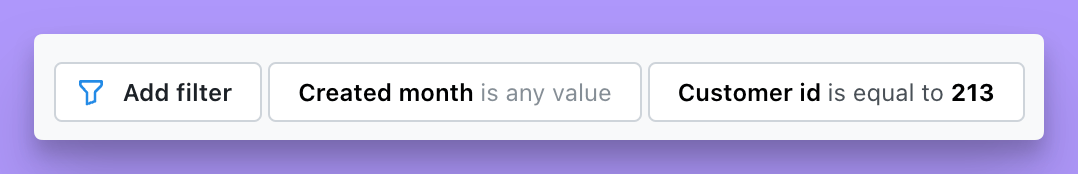
 4. And voilà! Your filters will pop up on the top of your dashboard.
 Values for temporary and overriden saved filters are reverted when entering Dashboard edit mode.
##### `Cross filtering` your dashboard using values in your tiles
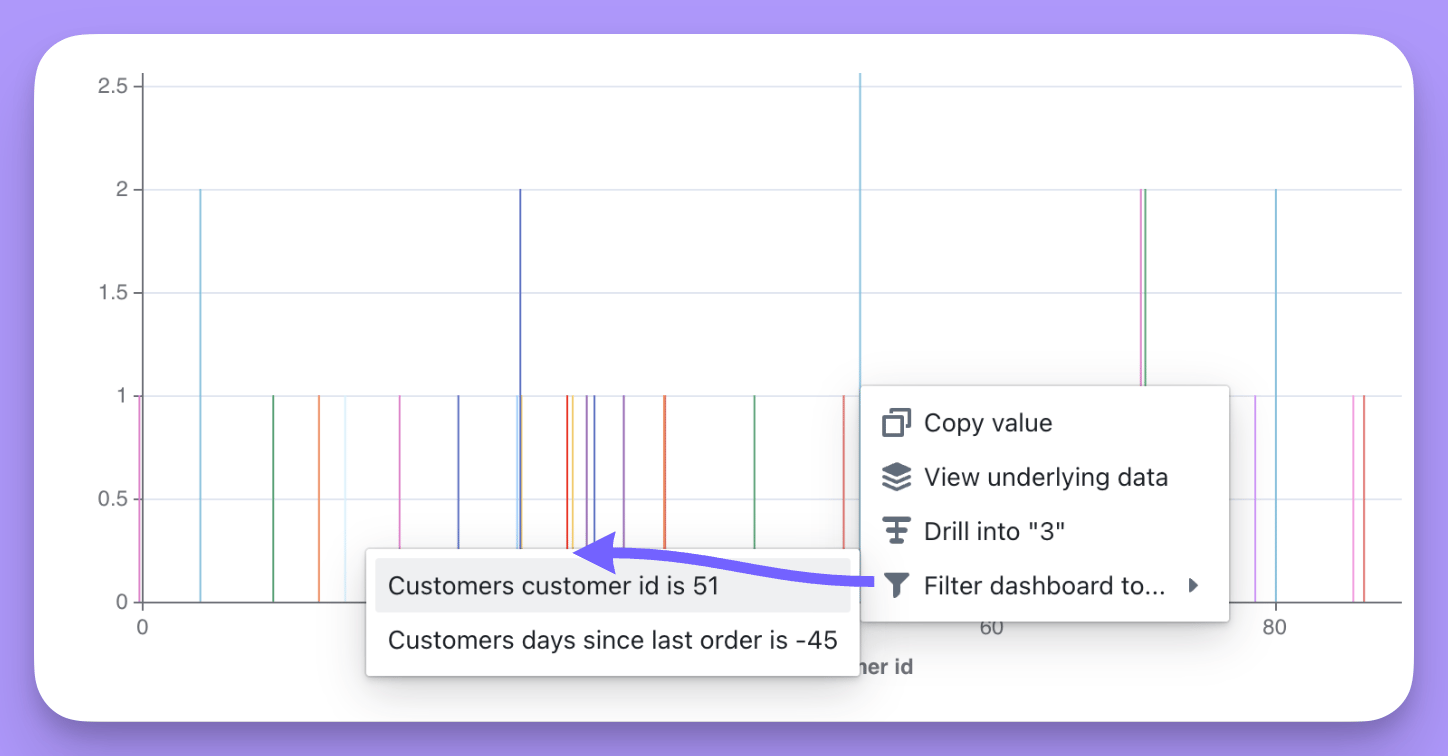
Cross-filtering lets you interact with one chart and apply that interaction as a filter to other charts in the dashboard. You can filter the dashboard using cross filtering by:
1. Clicking on one of the values in the chart.
2. Selecting the value you want to filter on from the drop-down list.
Values for temporary and overriden saved filters are reverted when entering Dashboard edit mode.
##### `Cross filtering` your dashboard using values in your tiles
Cross-filtering lets you interact with one chart and apply that interaction as a filter to other charts in the dashboard. You can filter the dashboard using cross filtering by:
1. Clicking on one of the values in the chart.
2. Selecting the value you want to filter on from the drop-down list.
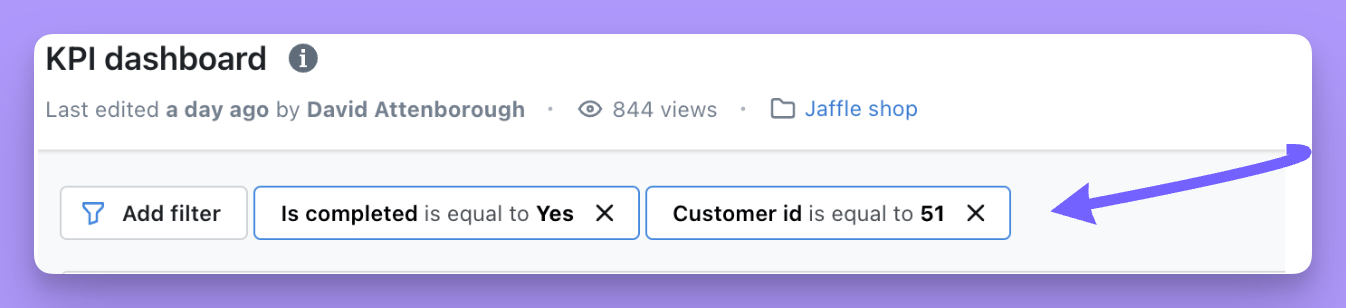
 3. Now, your filter will pop up on the top of your dashboard.
 ### Adding saved filters to your dashboard
If you add a saved filter to your dashboard, then anyone that opens the dashboard will see the saved filters applied.
To add saved filters, you just:
1. Open up your dashboard.
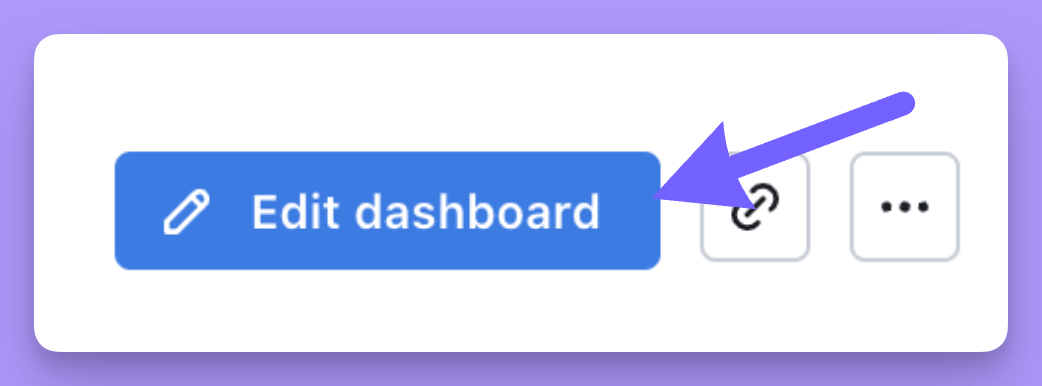
2. Make sure you're in `edit` mode (if you're not, you should see the option to click `Edit Dashboard`)
### Adding saved filters to your dashboard
If you add a saved filter to your dashboard, then anyone that opens the dashboard will see the saved filters applied.
To add saved filters, you just:
1. Open up your dashboard.
2. Make sure you're in `edit` mode (if you're not, you should see the option to click `Edit Dashboard`)
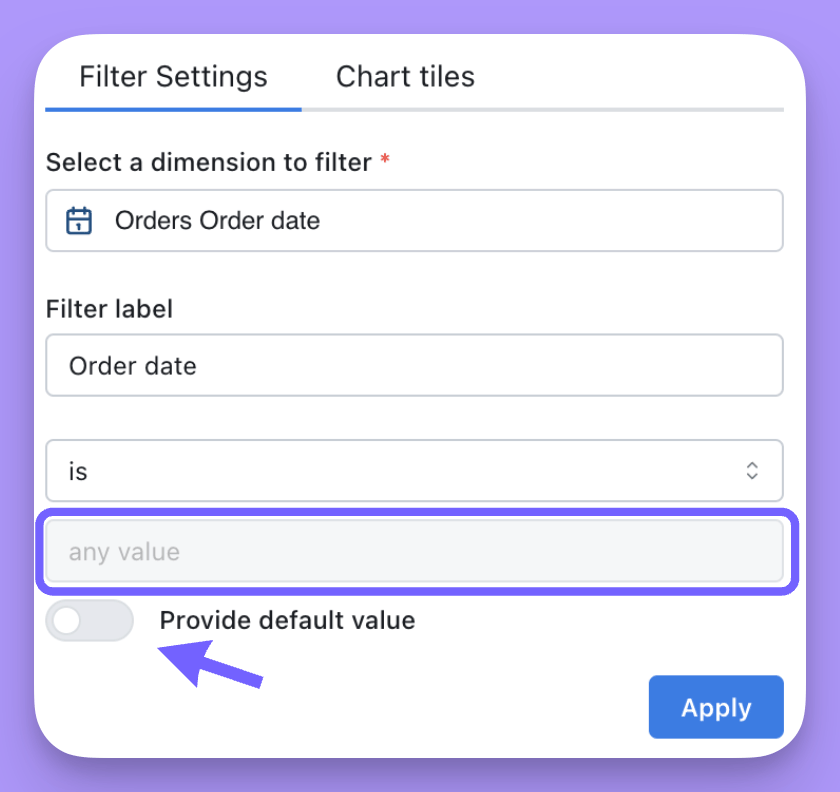
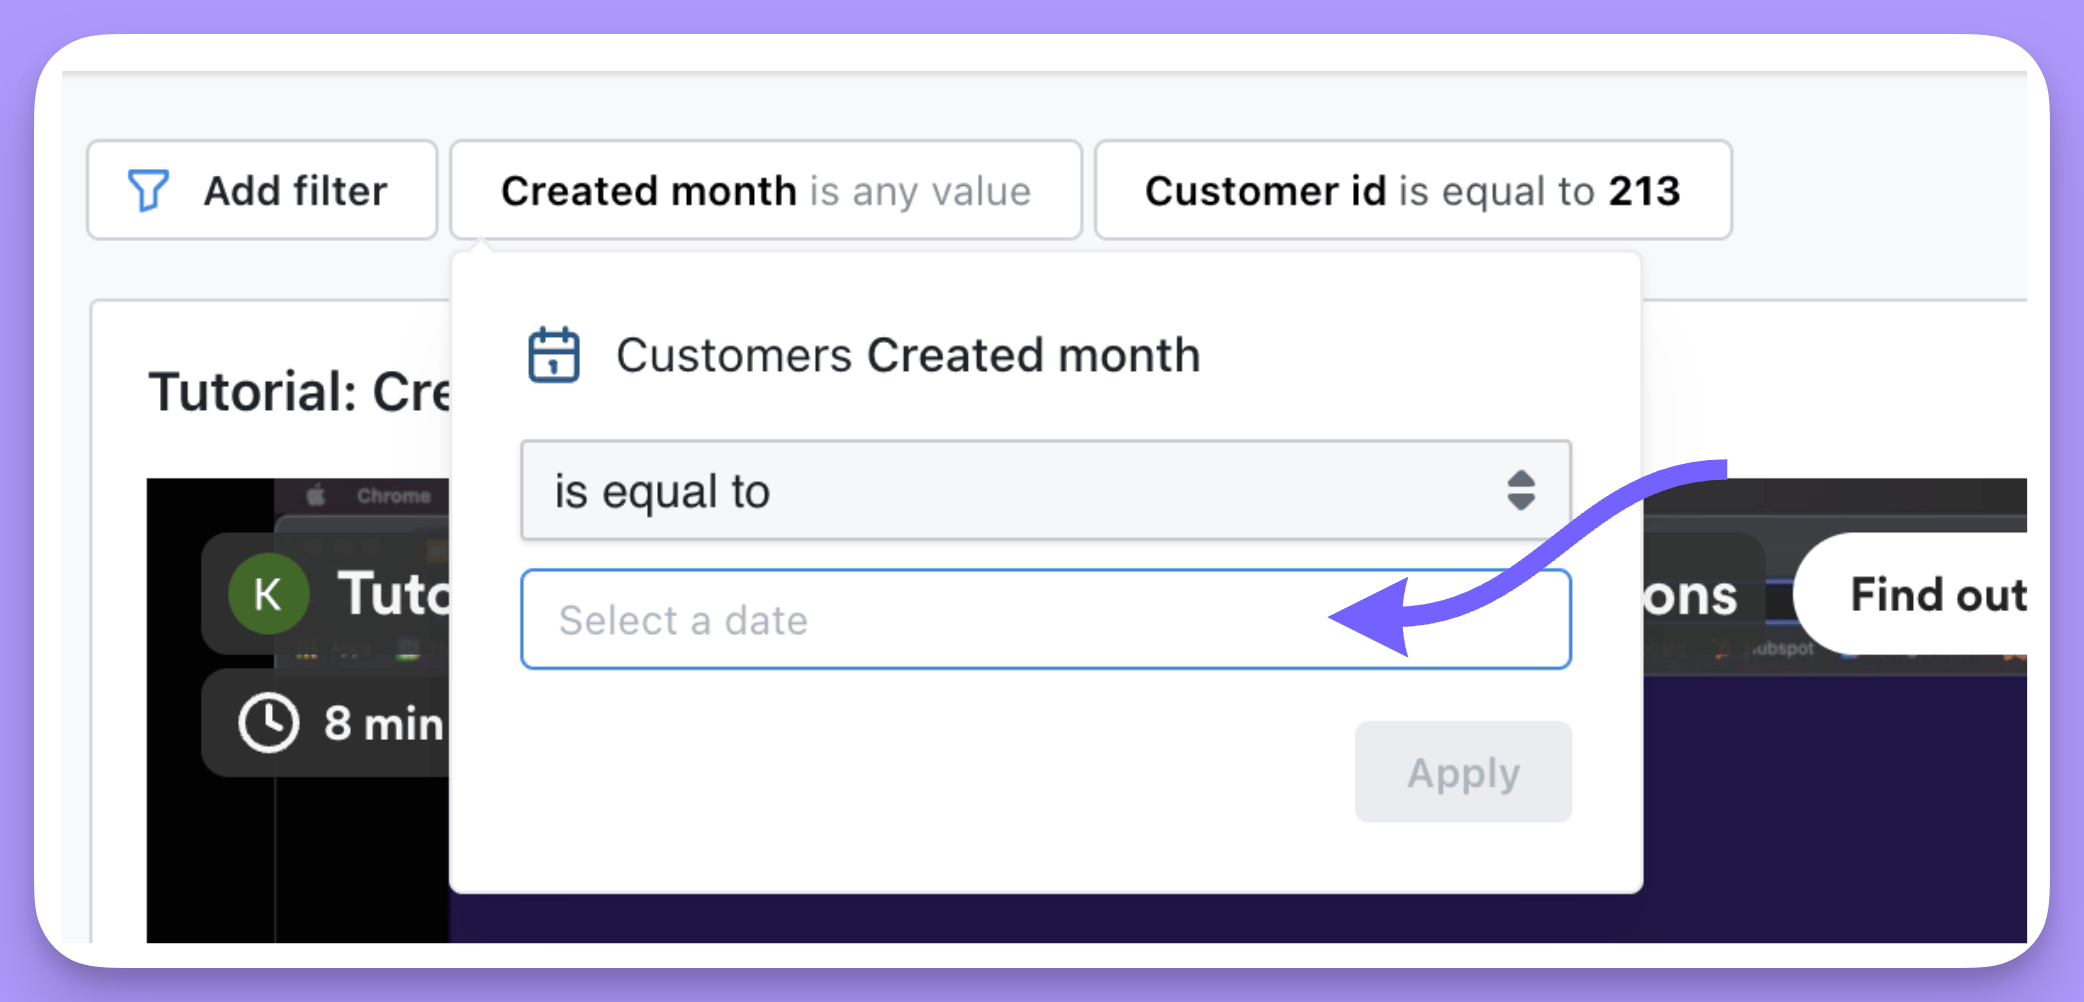
 3. Click `add filter`, then specify the dimension or metric that you want to filter on.
4. You can leave the value blank, or you can specify a value that you want to filter by:
If you leave the value blank, then no filter will be applied to the tiles in your dashboard. Importantly, this provides dashboard viewers the option to define a value in the filter, enabling them to tailor the results to their needs.
3. Click `add filter`, then specify the dimension or metric that you want to filter on.
4. You can leave the value blank, or you can specify a value that you want to filter by:
If you leave the value blank, then no filter will be applied to the tiles in your dashboard. Importantly, this provides dashboard viewers the option to define a value in the filter, enabling them to tailor the results to their needs.
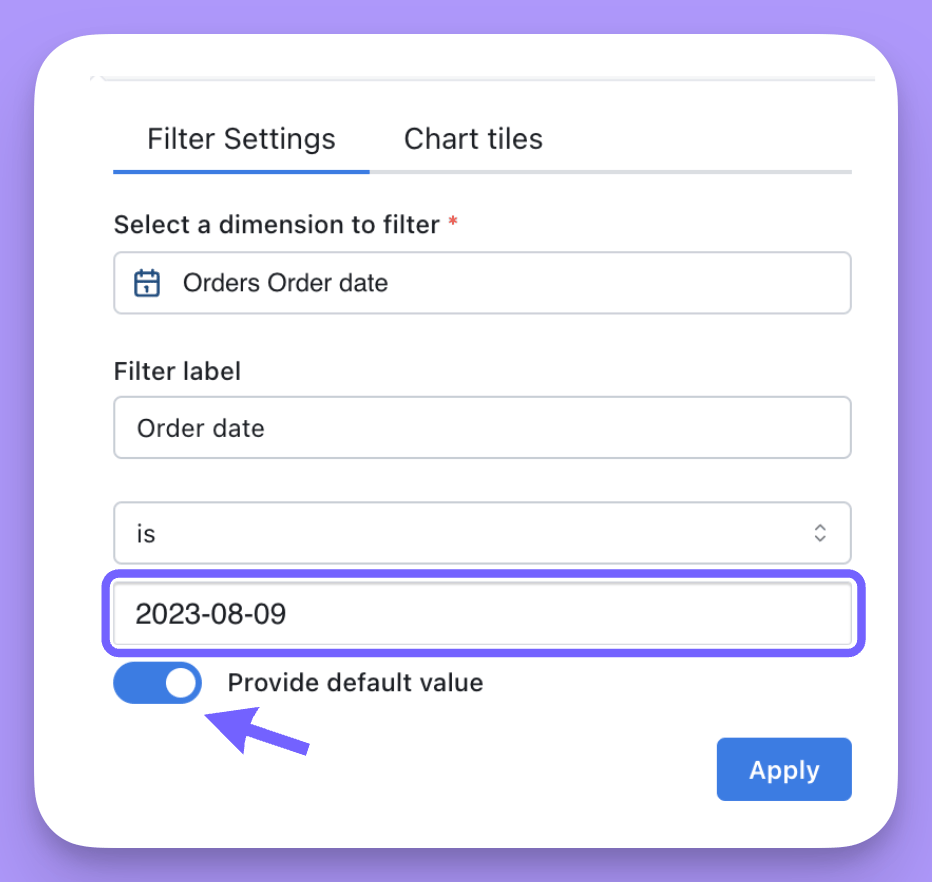
 If you want to specify a value, ensure you toggle 'Default value' so that you can apply a filter to the tiles in your dashboard.
 5. If you want, you can adjust which tiles the filter is applied to by clicking on the `Tiles` tab.
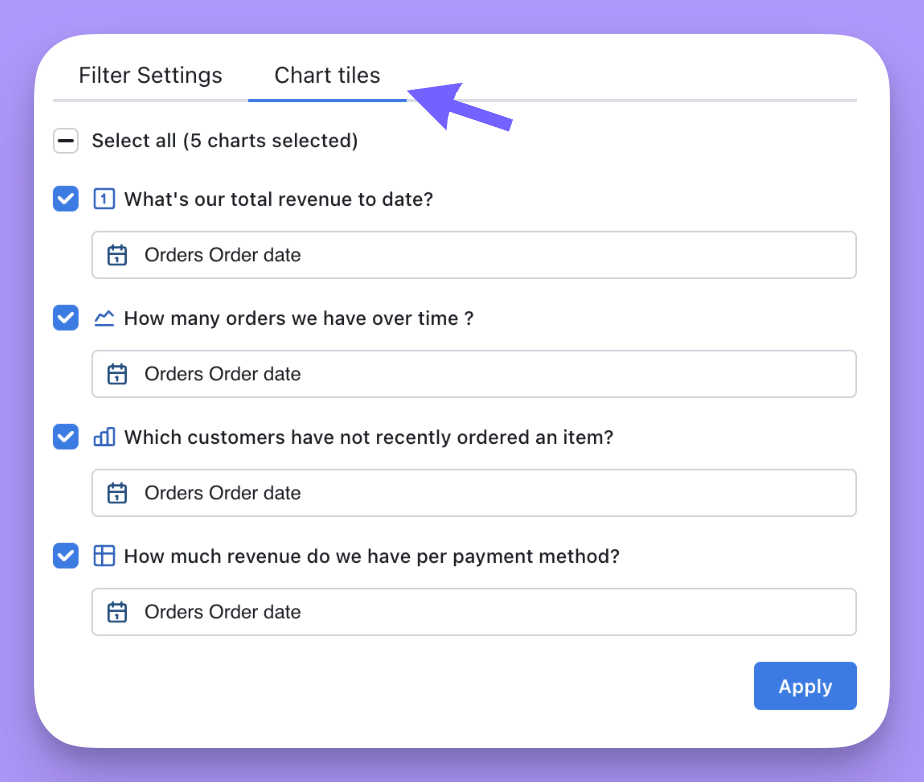 You can remove the filter from a certain tile, or you can change which field the filter is applied to in a tile.
6. Click `apply`, and your filters will pop up on the top of your dashboard.
You can remove the filter from a certain tile, or you can change which field the filter is applied to in a tile.
6. Click `apply`, and your filters will pop up on the top of your dashboard.
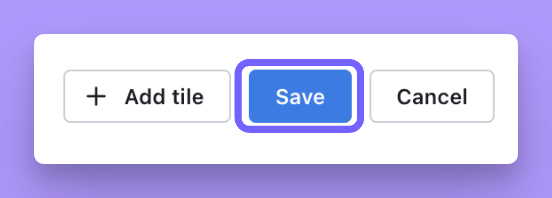
 7. Once you have all of the filters you want, just hit `save` to save your filter settings.
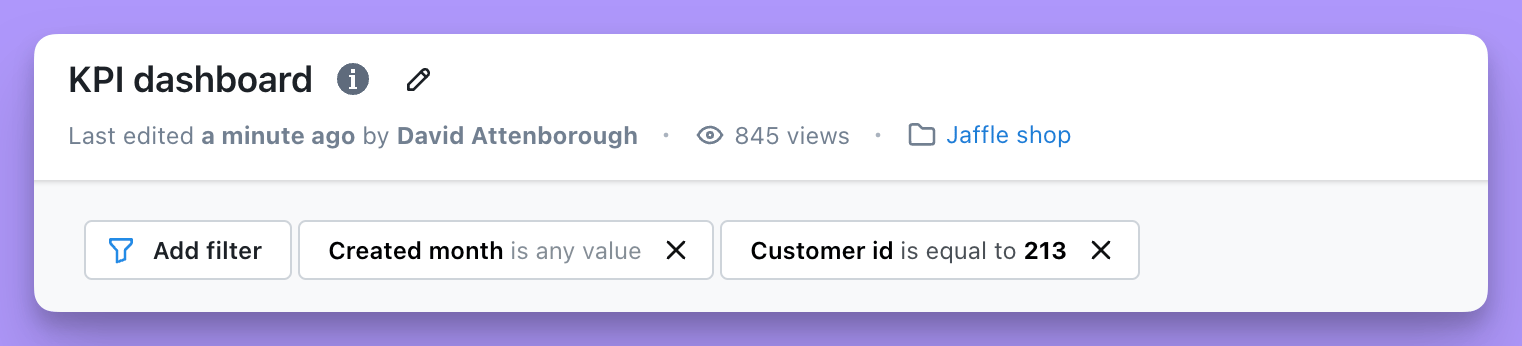
 Now, whenever someone opens the dashboard, they'll see your saved filters applied!
 And if they want to drill-down into the data, they can always change the filters by clicking on the filter and adjusting the values.
 To add saved filters to your dashboard, you must be an `editor` or an `admin` for your project.
### Filtering charts created in the SQL Runner
Dashboard filters can be applied to SQL Runner-based charts as well as charts from the Explorer. There are two different ways this can be done:
* On a dashboard with both Explorer and SQL Runner charts, filters are created the same way as above — you choose a field and create a filter.\
Then, in the **Chart tiles** tab, you can apply the filter to a SQL chart tile and choose the column you want that filter to apply to.
* On a dashboard with **only** SQL Runner-based tiles, filters are created a little differently since SQL charts are based on columns instead of semantic fields.
#### To create a filter on a dashboard with only SQL charts:
1. Choose a column from the list of all columns available across all charts.
2. Choose a filter label to give your filter a recognizable name.
3. Choose your filter operator and values as you would for any other filter.
By default, the new filter will be applied to every column on the dashboard that has the same name as the filtered column.
You can also choose, in the **Chart tiles** tab of the filter dropdown, exactly which tiles and columns to apply it to.
Note that as with Explorer-chart filters, you can only apply fitlers to dimensions (in this case, non-aggregated columns).
### Some things worth mentioning about dashboard filters
##### Sharing your dashboard with overrides
You might want to share a dashboard with someone with custom filters applied. To do this, you have to be in *view mode*. Then, you can either/or:
1. Apply temporary filters to your dashboard and share the link with the filters applied.
2. Apply changes(overrides) to your saved filters and share the link with the filters applied.
Rules for sharing dashboards with filters applied:
* In view mode and when adding a temporary filter, you can change the field, value, operator, and tiles this is applied to. But, you can't change the filter type (e.g. from `temporary filter` to `saved filter`).
* In view mode and when overriding a saved filter, you can only change the value and operator, so the field and tile configuration will remain the same.
* In edit mode, when changing a saved filter (with an override present), once you save the changes (click "Apply"), the override for that filter will be removed.
The same behaviour applies when exporting dashboards or sending them to email or Slack in [scheduled deliveries](/guides/how-to-create-scheduled-deliveries).
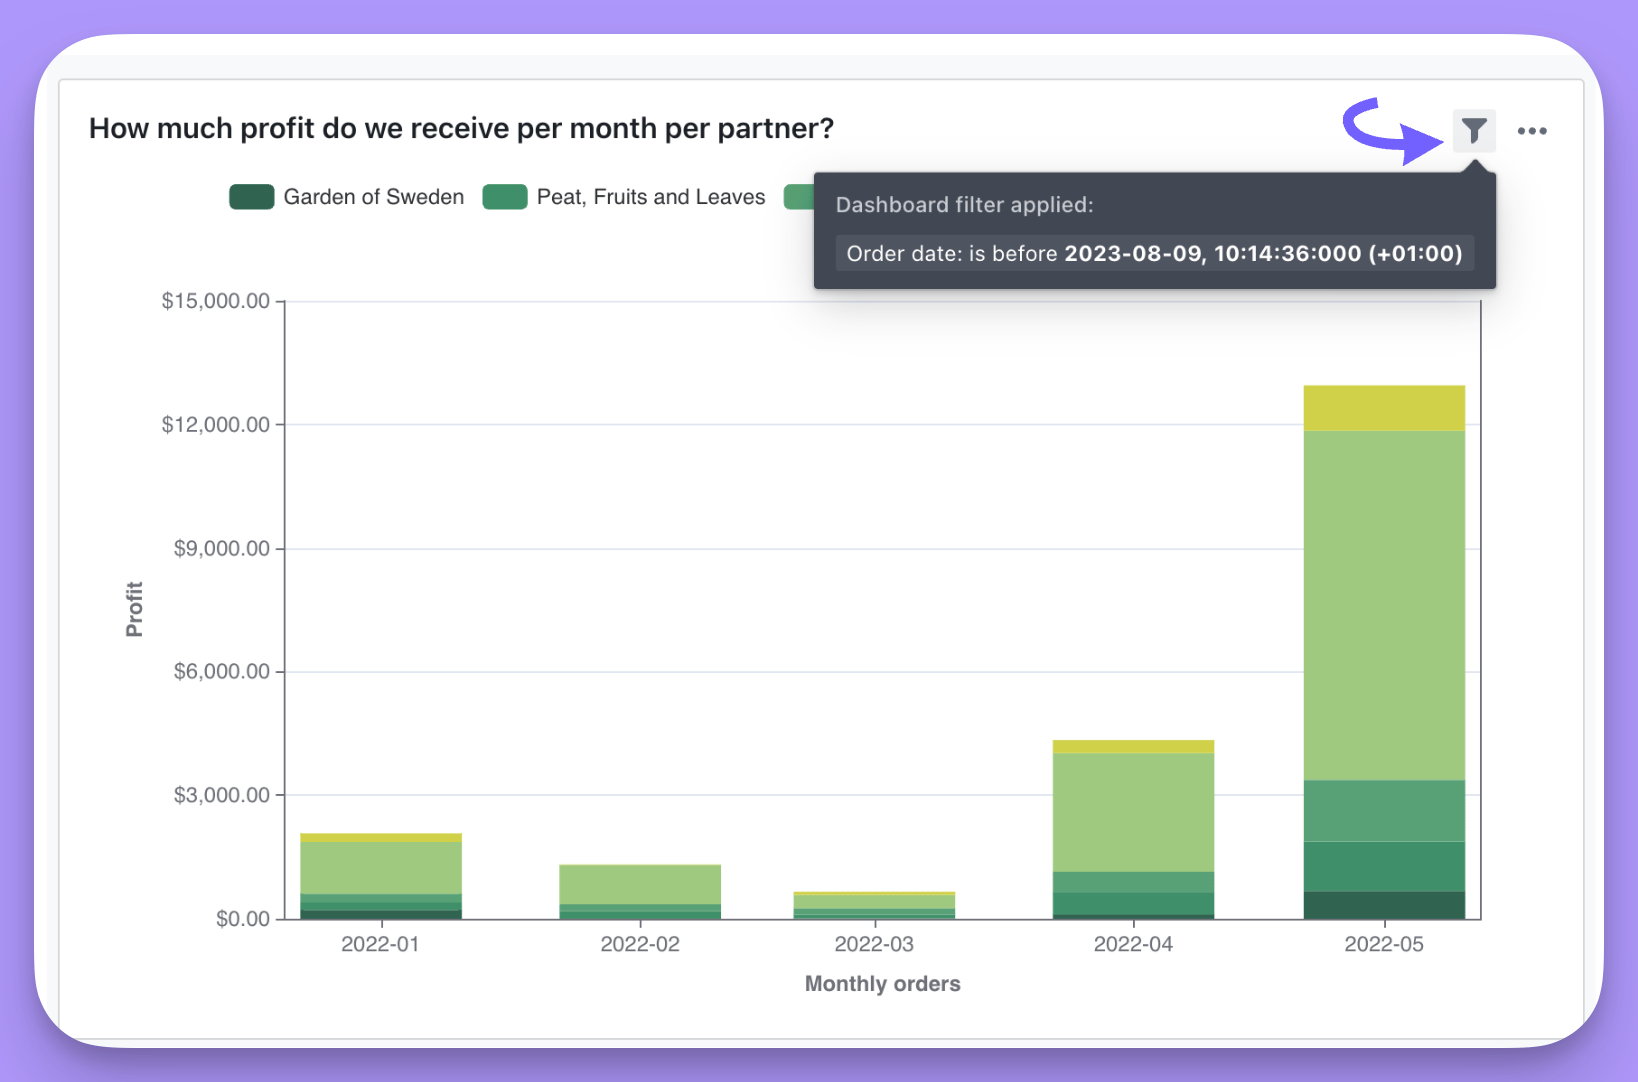
##### You can easily see which dashboard tiles have which filters applied to them
If a tile in a dashboard has a filter applied to it, you'll see the text `dashboard filter applied` on the tile.
You can also hover over this to see ***which*** filters have been applied to that tile.
To add saved filters to your dashboard, you must be an `editor` or an `admin` for your project.
### Filtering charts created in the SQL Runner
Dashboard filters can be applied to SQL Runner-based charts as well as charts from the Explorer. There are two different ways this can be done:
* On a dashboard with both Explorer and SQL Runner charts, filters are created the same way as above — you choose a field and create a filter.\
Then, in the **Chart tiles** tab, you can apply the filter to a SQL chart tile and choose the column you want that filter to apply to.
* On a dashboard with **only** SQL Runner-based tiles, filters are created a little differently since SQL charts are based on columns instead of semantic fields.
#### To create a filter on a dashboard with only SQL charts:
1. Choose a column from the list of all columns available across all charts.
2. Choose a filter label to give your filter a recognizable name.
3. Choose your filter operator and values as you would for any other filter.
By default, the new filter will be applied to every column on the dashboard that has the same name as the filtered column.
You can also choose, in the **Chart tiles** tab of the filter dropdown, exactly which tiles and columns to apply it to.
Note that as with Explorer-chart filters, you can only apply fitlers to dimensions (in this case, non-aggregated columns).
### Some things worth mentioning about dashboard filters
##### Sharing your dashboard with overrides
You might want to share a dashboard with someone with custom filters applied. To do this, you have to be in *view mode*. Then, you can either/or:
1. Apply temporary filters to your dashboard and share the link with the filters applied.
2. Apply changes(overrides) to your saved filters and share the link with the filters applied.
Rules for sharing dashboards with filters applied:
* In view mode and when adding a temporary filter, you can change the field, value, operator, and tiles this is applied to. But, you can't change the filter type (e.g. from `temporary filter` to `saved filter`).
* In view mode and when overriding a saved filter, you can only change the value and operator, so the field and tile configuration will remain the same.
* In edit mode, when changing a saved filter (with an override present), once you save the changes (click "Apply"), the override for that filter will be removed.
The same behaviour applies when exporting dashboards or sending them to email or Slack in [scheduled deliveries](/guides/how-to-create-scheduled-deliveries).
##### You can easily see which dashboard tiles have which filters applied to them
If a tile in a dashboard has a filter applied to it, you'll see the text `dashboard filter applied` on the tile.
You can also hover over this to see ***which*** filters have been applied to that tile.
 ##### Dashboard filters override filters applied in a saved chart on the same field
For example, if I had a chart for Sales in Asia and I filtered to `country` **is** `China`, `India`, `Japan`. Then, on my dashboard I added a filter `country` **is** `India`. My saved chart's filter would be removed, and my new dashboard filter would be applied instead, so the tile in the dashboard would be filtered to: `country` **is** `India`.
Here's another example using a date filter: If my original saved chart was filtered to only include orders completed on or after April 3rd, 2024. But, I add a date filter to my dashboard to include orders completed on or after August 1st, 2024, then the dashboard filter would override the saved chart filter and I'll end up with the chart filtered by orders completed on or after August 1st, 2022.
**How charts work in this context:**
* When you **Explore from here** from a dashboard, the chart will include the same filters you saw on the Dashboard version. Any filters overriden in the dahsboard will be overriden in the **Explore from here** view. Filters NOT overriden in the dashboad will be the same as they were in the original chart.
* If you 'Edit' the chart instead of explore from here, you will see the original chart filters.
Here's another example using a date filter: If my original saved chart was filtered to only include orders completed on or after April 3rd, 2022. But, I add a date filter to my dashboard to include orders completed on or after August 1st, 2022, then the dashboard filter would be added to the saved chart filter and I'll end up with the chart filtered by orders completed on or after August 1st, 2022.
##### Dashboard filters autocomplete
When determining possible values for a dashboard filter, the system will take into account all relevant filters, including those applied to fields from joined tables.
Example with payments and orders models:
```yaml theme={null}
- name: customers
---
- name: orders
meta:
joins:
- join: customers
sql_on: ${customers.customer_id} = ${orders.customer_id}
---
- name: payments
meta:
joins:
- join: orders
sql_on: ${orders.order_id} = ${payments.order_id}
- join: customers
sql_on: ${customers.customer_id} = ${orders.customer_id}
```
```yaml theme={null}
- name: customers
---
- name: orders
config:
meta:
joins:
- join: customers
sql_on: ${customers.customer_id} = ${orders.customer_id}
---
- name: payments
config:
meta:
joins:
- join: orders
sql_on: ${orders.order_id} = ${payments.order_id}
- join: customers
sql_on: ${customers.customer_id} = ${orders.customer_id}
```
```yaml theme={null}
# customers.yml
type: model
name: customers
---
# orders.yml
type: model
name: orders
joins:
- join: customers
sql_on: ${customers.customer_id} = ${orders.customer_id}
---
# payments.yml
type: model
name: payments
joins:
- join: orders
sql_on: ${orders.order_id} = ${payments.order_id}
- join: customers
sql_on: ${customers.customer_id} = ${orders.customer_id}
```
Following this example:
* when filtering on a field from the `payments` model, the system will consider the filters applied to fields from the `payments`, `orders` and `customers` models
* when filtering on a field from the `orders` model, the system will consider the filters applied to fields from the `orders` and `customers` models
* when filtering on a field from the `customers` model, the system will consider the filters applied to fields from the `customers` model
##### Dashboard filters override filters applied in a saved chart on the same field
For example, if I had a chart for Sales in Asia and I filtered to `country` **is** `China`, `India`, `Japan`. Then, on my dashboard I added a filter `country` **is** `India`. My saved chart's filter would be removed, and my new dashboard filter would be applied instead, so the tile in the dashboard would be filtered to: `country` **is** `India`.
Here's another example using a date filter: If my original saved chart was filtered to only include orders completed on or after April 3rd, 2024. But, I add a date filter to my dashboard to include orders completed on or after August 1st, 2024, then the dashboard filter would override the saved chart filter and I'll end up with the chart filtered by orders completed on or after August 1st, 2022.
**How charts work in this context:**
* When you **Explore from here** from a dashboard, the chart will include the same filters you saw on the Dashboard version. Any filters overriden in the dahsboard will be overriden in the **Explore from here** view. Filters NOT overriden in the dashboad will be the same as they were in the original chart.
* If you 'Edit' the chart instead of explore from here, you will see the original chart filters.
Here's another example using a date filter: If my original saved chart was filtered to only include orders completed on or after April 3rd, 2022. But, I add a date filter to my dashboard to include orders completed on or after August 1st, 2022, then the dashboard filter would be added to the saved chart filter and I'll end up with the chart filtered by orders completed on or after August 1st, 2022.
##### Dashboard filters autocomplete
When determining possible values for a dashboard filter, the system will take into account all relevant filters, including those applied to fields from joined tables.
Example with payments and orders models:
```yaml theme={null}
- name: customers
---
- name: orders
meta:
joins:
- join: customers
sql_on: ${customers.customer_id} = ${orders.customer_id}
---
- name: payments
meta:
joins:
- join: orders
sql_on: ${orders.order_id} = ${payments.order_id}
- join: customers
sql_on: ${customers.customer_id} = ${orders.customer_id}
```
```yaml theme={null}
- name: customers
---
- name: orders
config:
meta:
joins:
- join: customers
sql_on: ${customers.customer_id} = ${orders.customer_id}
---
- name: payments
config:
meta:
joins:
- join: orders
sql_on: ${orders.order_id} = ${payments.order_id}
- join: customers
sql_on: ${customers.customer_id} = ${orders.customer_id}
```
```yaml theme={null}
# customers.yml
type: model
name: customers
---
# orders.yml
type: model
name: orders
joins:
- join: customers
sql_on: ${customers.customer_id} = ${orders.customer_id}
---
# payments.yml
type: model
name: payments
joins:
- join: orders
sql_on: ${orders.order_id} = ${payments.order_id}
- join: customers
sql_on: ${customers.customer_id} = ${orders.customer_id}
```
Following this example:
* when filtering on a field from the `payments` model, the system will consider the filters applied to fields from the `payments`, `orders` and `customers` models
* when filtering on a field from the `orders` model, the system will consider the filters applied to fields from the `orders` and `customers` models
* when filtering on a field from the `customers` model, the system will consider the filters applied to fields from the `customers` model